Bitcoin Cash Price Prediction 2025, 2026 – 2030: Will BCH Hit $1000?


Story Highlights
- The current trading price of Bitcoin Cash stands at $536.56
- Price predictions for 2025 range from $300 to $710, with strong support established at the $300 level
- By 2030, BCH could potentially reach highs of $2,675, driven by increased adoption rates and growing transaction activity across the network
With Bitcoin breaking through the $100K barrier, market attention has shifted to Bitcoin Cash (BCH) as traders analyze whether BCH price will follow with a significant upward movement of its own. Beyond market speculation, Bitcoin Cash has been demonstrating substantial real-world utility. Ranked 4th on Crypwerk's global adoption list, BCH has been gaining notable traction due to its transaction speed, minimal fees, and merchant-friendly infrastructure design.
For those seeking insights into "Will Bitcoin Cash continue its upward trajectory?" — this comprehensive analysis addresses that question. In this Bitcoin Cash price prediction covering 2025–2030, we examine the technical indicators and adoption trends that are shaping the next phase of BCH price development.
Overview
Cryptocurrency: Bitcoin Cash Token: BCH Price: $536.56 (-3.85%) Market cap: $10,680,737,977 Circulating Supply: 19,905,828 BCH Trading Volume: $444,345,632 All-time high: $4,355.62 (recorded on December 20th, 2017) All-time low: $75.08 (recorded on December 15th, 2018)
Bitcoin Cash has established itself as a prominent fork of Bitcoin, focusing on enhanced scalability and lower transaction costs. The cryptocurrency has maintained a strong position in the market, with its circulating supply approaching 20 million tokens. The historical price range demonstrates significant volatility, with the all-time high representing nearly a 58x increase from the all-time low, indicating substantial growth potential during favorable market conditions.
CoinPedia's Bitcoin Cash Price Prediction
CoinPedia's comprehensive analysis suggests that Bitcoin Cash could potentially position itself as a more accessible and cost-effective alternative to Bitcoin, offering similar security features with enhanced transaction efficiency.
Should Bitcoin Cash generate increased market interest and adoption momentum in the coming months, the BCH price could potentially reach $701 during 2025. This projection is based on technical analysis of historical patterns and current market dynamics. Conversely, in a bearish scenario, the BCH price may establish support around $507 during the same period, representing a conservative baseline for price action.
Market analysts anticipate that BCH price could establish a new 2025 high of $701 during the projected altcoin season, when alternative cryptocurrencies typically experience heightened trading activity and capital inflows.
| Year | Potential Low | Potential Average | Potential High |
|---|---|---|---|
| 2025 | $507 | $605 | $701 |
Bitcoin Cash Price Target August 2025
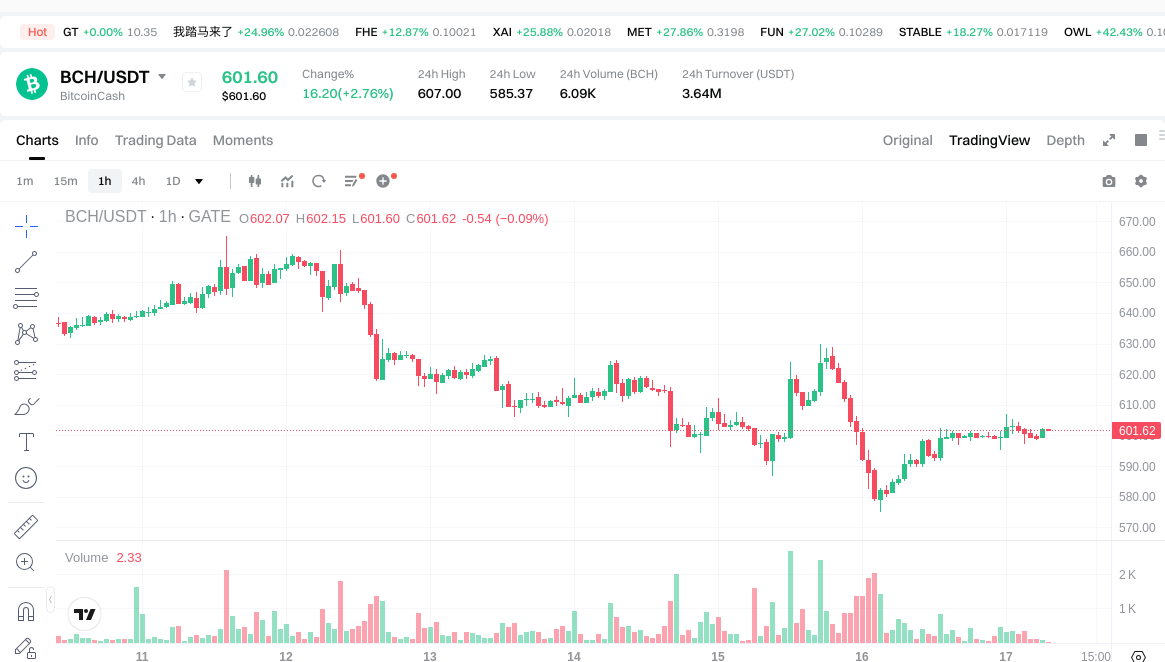
In the projected August 2025 period, Bitcoin Cash (BCH) is expected to trade near the 20-day Exponential Moving Average (EMA) band following an observed decline from the $607 level. Despite this temporary retracement, the underlying uptrend structure remains intact in the short-term timeframe, suggesting continued bullish potential.
The July rally provided a long-awaited breakout from a descending triangle pattern, a technical formation that typically signals the continuation of an upward trend. In August, market sentiment remains optimistic regarding the potential for a more substantial rally phase. This pattern breakout represents a significant technical development, as descending triangles often precede major price movements when successfully breached to the upside.
Following the breakout, BCH has established realistic short-term targets at $640 and $689. These levels represent key resistance zones where profit-taking activity may temporarily pause the advance. The $522 level, which previously served as a significant resistance barrier, has now transformed into a support level following its breach. This conversion of resistance to support is a bullish technical indicator that strengthens the overall uptrend structure.
However, in scenarios where bearish pressure dominates market sentiment, if the $522 support level fails to hold, the $300 support zone is projected to provide substantial downside protection. This level represents a critical long-term support area that has historically absorbed selling pressure and could serve as a foundation for future price recovery if the breakout momentum weakens.
| Month | Potential Low ($) | Potential Average ($) | Potential High ($) |
|---|---|---|---|
| July 2025 | 422 | 522 | 689 |
BCH Price Prediction 2025
Bitcoin Cash (BCH) has demonstrated a long-term price trajectory that consistently respects a multi-year resistance trendline. Historical analysis reveals that during each bull market cycle, the price tends to encounter resistance and reverse upon reaching this critical line, making it a key technical level for traders and analysts to monitor.
In 2025, this pattern manifests as a descending triangle formation on the monthly (1-M) timeframe chart. Previously, the price struggled repeatedly to breach this trendline, creating a pattern of lower highs that defined the descending triangle structure. However, a significant rally that commenced in April during Q2 2025 propelled BCH from a low of $249 to a high of $550 by July, representing a more than 120% increase. This substantial move was largely fueled by broader market optimism and Bitcoin's achievement of new all-time highs, which typically creates positive sentiment across the entire cryptocurrency sector.
The breakout from this multi-year pattern indicates the potential for a much larger rally phase, with some analysts projecting the possibility of new all-time highs. Pattern breakouts of this magnitude often lead to extended price movements, as they represent a fundamental shift in market structure and investor psychology.
However, a more conservative forecast approach suggests that BCH has successfully cleared the $522 resistance level, which was a critical barrier. In late July, the price spiked to $607 before experiencing a natural retracement to the 20-day EMA band in early August. This pullback represents healthy price action, allowing the market to consolidate gains before potentially continuing higher.
Despite the observed retreat, the Q2 rally momentum has continued into Q3, and the core uptrend structure has not been compromised. If bullish demand experiences a surge, August may see a retest of the $607 level, with the potential to flip and establish new targets at $640 and $689. These levels represent Fibonacci extension targets and previous resistance zones that could act as stepping stones toward higher price levels.
Should the price maintain trading activity above $689 throughout Q3, it would signify a Change of Character (ChoCh) on the monthly timeframe chart. This technical development would indicate a shift from a bearish to bullish market structure, potentially opening the door for significantly higher price targets.
Consequently, if bullish momentum persists and market conditions remain favorable, BCH price could realistically achieve targets of $990 and $1,200 during 2025. These projections are based on measured move calculations from the descending triangle pattern and historical price behavior during previous bull market cycles. Conversely, in scenarios where the breakout fails to sustain momentum, the $300 support level is anticipated to provide substantial protection against further declines, representing a key long-term support zone that has historically attracted buying interest.
| Year | Potential Low | Potential Average | Potential High |
|---|---|---|---|
| 2025 | $300 | $605 | $1,200 |
Bitcoin Cash Price Targets 2026 – 2030
| Year | Potential Low ($) | Potential Average ($) | Potential High ($) |
|---|---|---|---|
| 2026 | 595 | 798 | 1,160 |
| 2027 | 876 | 1,135 | 1,475 |
| 2028 | 1,025 | 1,480 | 1,955 |
| 2030 | 1,350 | 2,010 | 2,675 |
This comprehensive projection table, derived from historical price movements and market cycle analysis, indicates that BCH price could potentially reach $2,675 by 2030. These projections are based on compounding market capitalization growth patterns observed in previous cryptocurrency market cycles. The methodology assumes continued adoption growth, network expansion, and favorable macroeconomic conditions for cryptocurrency assets.
The year-over-year progression reflects realistic growth rates that account for both bull and bear market phases within the broader cryptocurrency cycle. The 2026 projections suggest consolidation following the anticipated 2025 rally, while 2027-2028 targets reflect the potential impact of the next Bitcoin halving cycle, which historically has positive effects on major cryptocurrencies including Bitcoin Cash.
By 2030, the high target of $2,675 represents approximately a 5x increase from current levels, which would be consistent with Bitcoin Cash achieving greater mainstream adoption and increased utility as a payment system. This table provides a structured framework for understanding potential BCH price movements over the medium to long term. However, it's important to note that actual price performance will depend on numerous factors including overall cryptocurrency market dynamics, investor sentiment, regulatory developments, technological improvements to the Bitcoin Cash network, and external macroeconomic factors influencing the broader cryptocurrency landscape.
Market Analysis
| Firm Name | 2025 | 2026 | 2030 |
|---|---|---|---|
| Changelly | $361 | $664 | $3,731 |
| priceprediction.net | $572 | $865 | $3,830 |
| DigitalCoinPrice | $821 | $932 | $2,912 |
*The targets mentioned above represent the average price projections established by the respective analytical firms based on their proprietary forecasting methodologies.
This comparative analysis of predictions from leading cryptocurrency forecasting firms reveals a general consensus regarding Bitcoin Cash's long-term bullish potential, though with varying degrees of optimism. Changelly's projections suggest more conservative near-term targets but extremely bullish long-term expectations, with a 2030 target of $3,731. This represents one of the most optimistic long-term forecasts among major analytical platforms.
Priceprediction.net offers middle-ground estimates, with a 2025 target of $572 that aligns closely with current technical analysis, progressing to $3,830 by 2030. This firm's methodology typically incorporates machine learning algorithms and historical pattern recognition. DigitalCoinPrice presents the most bullish near-term forecast at $821 for 2025, suggesting stronger immediate growth potential, though their 2030 projection of $2,912 is slightly more conservative than the other firms.
The convergence of these independent analyses around similar long-term price ranges (approximately $2,900-$3,800 by 2030) provides additional confidence in the overall bullish thesis for Bitcoin Cash. The variation in near-term projections (2025-2026) reflects the inherent uncertainty in short-term price movements, while the alignment of long-term targets suggests that fundamental factors supporting BCH adoption and utility are widely recognized across the analytical community.
FAQ
What is Bitcoin Cash (BCH) and how does it differ from Bitcoin?
Bitcoin Cash (BCH) is a cryptocurrency that forked from Bitcoin in 2017. BCH features larger block sizes enabling faster transactions and lower fees compared to BTC. The main difference lies in scalability, making BCH more efficient for everyday transactions.
What is the price prediction for Bitcoin Cash from 2025-2030? Is it possible to reach $1000?
BCH is predicted to reach $605.04 by end of 2025. By 2028, prices may fluctuate between $813 and $1,586, averaging $1,044. Yes, reaching $1000 is achievable within this period based on current projections.
What are the main factors affecting BCH price?
BCH price is primarily affected by market competition from other cryptocurrencies, ecosystem development and application adoption, trading volume and liquidity, investor sentiment and confidence, Bitcoin's price movements, regulatory developments, and technological innovations or upgrades to the BCH network.
What are Bitcoin Cash's current technological development and application scenarios?
Bitcoin Cash optimizes transaction speed and capacity, enhances smart contracts and privacy features, and expands use in retail and payment systems globally.
What are the risks to pay attention to when investing in Bitcoin Cash?
Key risks include market volatility, regulatory uncertainty, and technology vulnerabilities. BCH price fluctuates significantly, policy changes may impact legality, and technical flaws could compromise security. Competition from other cryptocurrencies and adoption challenges also pose risks.
BCH in the cryptocurrency market, how is its competitive position?
BCH maintains a strong position in fast, low-cost payments, competing with newer blockchains. It excels in emerging markets as a payment tool. Despite market fluctuations, BCH's technology foundation and expanding adoption create significant growth potential for future value appreciation.
What major price fluctuations has Bitcoin Cash experienced historically?
Bitcoin Cash surged dramatically in 2017-2018, peaking above $9,000 in December 2017. It then crashed to around $200 in early 2019. Since then, BCH has experienced significant volatility, with periodic recoveries and corrections as market conditions evolved.

What is the Current Market Overview for Cryptocurrencies in December 2025?

How Does BCH On-Chain Data Analysis Reveal Market Trends in 2025?

Understanding Cryptocurrency Market Capitalization: Key Insights
How Does POWER Price Volatility Compare to Other Cryptocurrencies?
How Does Macroeconomic Policy Influence Cryptocurrency Prices in 2025?
How Does Litecoin's Holding and Fund Flow Compare to Bitcoin in 2025?

Hamster Kombat Daily Cipher Code Guide: Unlock Bonus Rewards with Morse Code

How does PROM community activity and GitHub developer engagement impact its ecosystem growth in 2025?
How do crypto derivatives market signals predict the next price move: futures open interest, funding rates, and liquidation data explained

What is STABLE token price, market cap, and 24-hour trading volume in 2026?

Will Shiba Inu Reach 1 Cent in the Near Future