Bull and Bear Flags: How to Spot and Trade Them in Crypto


Main Takeaways
-
When spotted in a strongly trending market, flag patterns can be potential indicators for traders relying on technical analysis to go long or short.
-
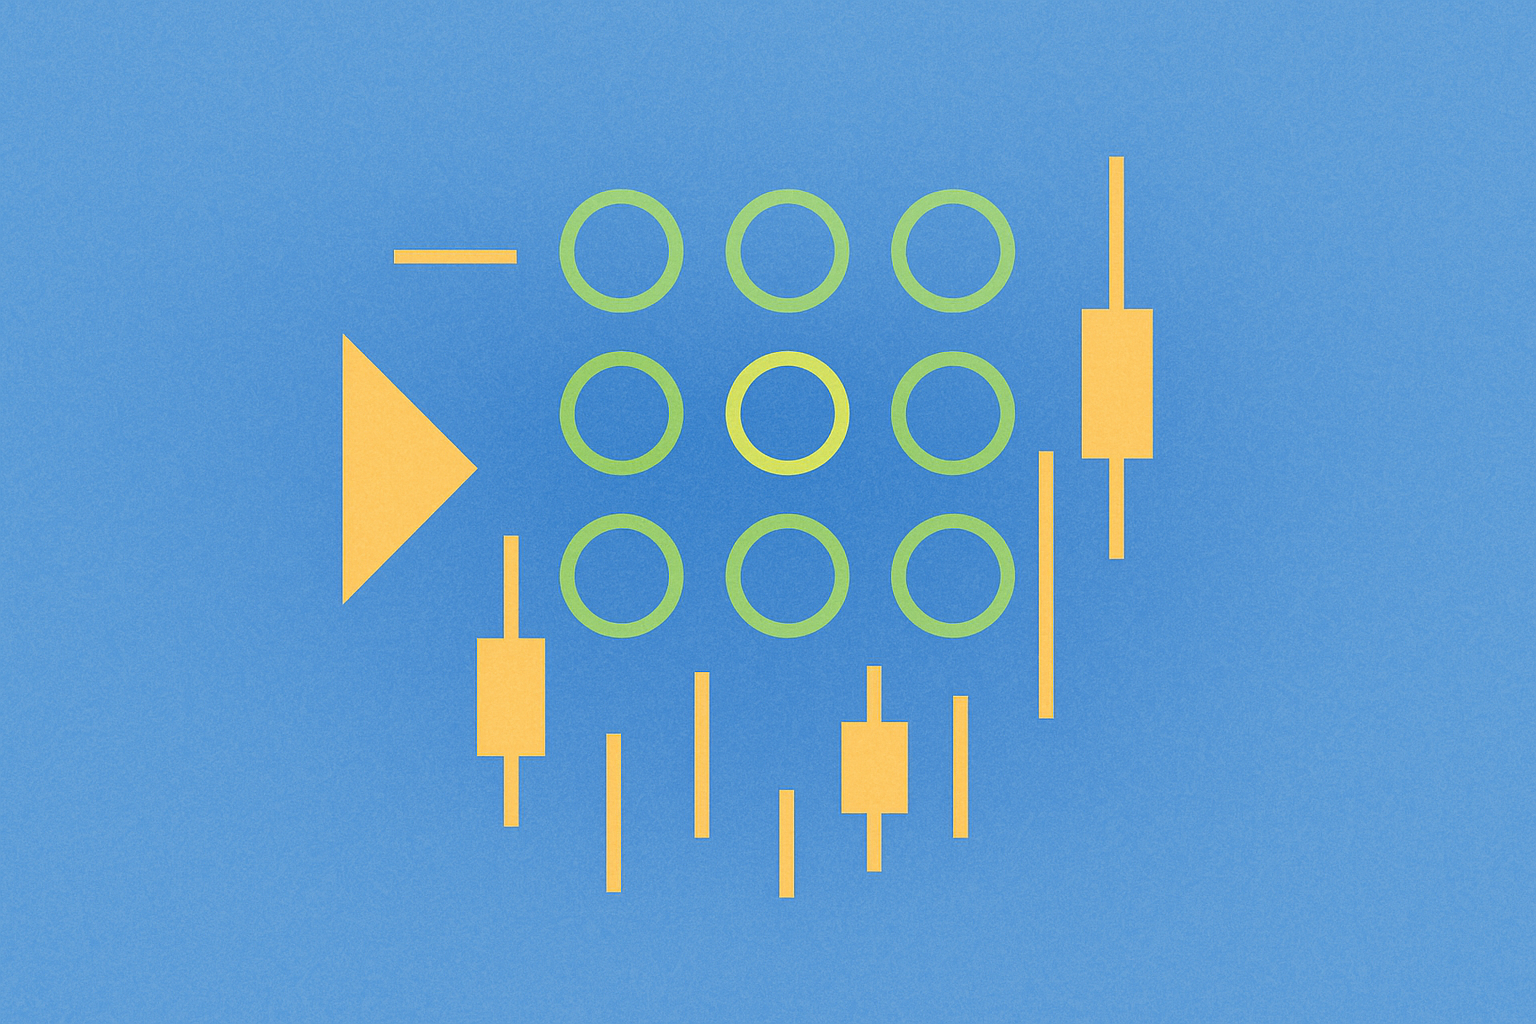
Bull flags and bear flags are commonly traded continuation patterns made up of three main components – the pole, flag, and breakout point.
-
Traders can use flags with other indicators, such as the Relative Strength Index, to gauge how overbought or oversold an asset may be.
Identifying trends early while trading in digital assets allows users to plan and execute their trades effectively. Chart patterns are an essential tool many technical analysts utilize to try and anticipate future movements of digital asset prices. These patterns serve as visual representations of market psychology, reflecting the collective behavior of buyers and sellers during specific market conditions.
Bullish and bearish chart patterns can suggest whether a price trend will extend or reverse. Among these patterns, flags are quite popular in technical analysis as they can provide valuable insights into price trends and potential future movements. Flag patterns formed by lines and shapes drawn onto price charts can be useful in identifying forthcoming trends, breakouts, and reversals. Understanding these patterns requires careful observation of price action, volume dynamics, and the broader market context in which they form.
This article explores two types of flag patterns – bull and bear flags – and provides insights into how traders can use them to make informed trading decisions in the cryptocurrency market.
What Are Bull and Bear Flags?
Bullish and bearish flags are among the most popular continuation patterns, typically spotted when the current trend is likely to continue to prevail. These patterns represent temporary pauses in strong price movements, where the market consolidates before resuming its original direction.
Bull flags typically appear in an uptrend when the price trend is expected to continue upward. These patterns indicate that buyers are taking a brief pause after a strong rally, gathering momentum before pushing prices higher. Bear flags are usually observed in a downtrend when the asset's price is anticipated to face further downside pressure. In this case, sellers are consolidating their positions before continuing to drive prices lower.
Each flag pattern consists of two main components: the pole and the flag. The pole represents a significant move higher or lower, depending on whether it is a bullish or bearish flag. This sharp price movement reflects strong momentum in one direction, often driven by significant news, market sentiment shifts, or large trading activity. Typically, a considerable surge in trading volume accompanies the creation of the flag pole, confirming the strength of the initial move.
Following the formation of the flag pole is a consolidation phase. This looks similar to an ascending or descending parallel channel and creates the flag of the chart pattern. During this phase, the price moves within a relatively narrow range, forming parallel trend lines that contain the price action. This consolidation represents a period where traders are reassessing their positions, with neither buyers nor sellers having complete control.
For bull flags, the pole precedes the flag, while for bear flags, the flag forms before the pole. Understanding this sequence is crucial for properly identifying these patterns and anticipating the likely direction of the breakout.
Bull Flags vs Bear Flags: Key Differences
| Parameter | Bull Flag | Bear Flag |
|---|---|---|
| Market Trend | Forms in an uptrend, signaling continuation. | Forms in a downtrend, signaling further decline. |
| Price Movement | Strong upward move followed by consolidation. | Strong downward move followed by consolidation. |
| Breakout Direction | Upward: breaks above the flag's resistance line. | Downward: breaks below the flag's support line. |
| Entry Point | When the price breaks above the upper flag boundary. | When the price breaks below the lower flag boundary. |
| Target Price Calculation | Measure flagpole height and add it to breakout level. | Measure flagpole height and subtract it from breakout level. |
| Stop-Loss Placement | Below the flag's lower boundary (support line). | Above the flag's upper boundary (resistance line). |
| Volume & Sentiment | Volume surges on breakout, indicating bullish momentum. | Volume surges on breakdown, indicating bearish pressure. |
| Retracement Level | Typically 38.2% to 50% of the flagpole height. | Typically 38.2% to 50% of the flagpole height. |
| Confirmation Factors | RSI near overbought territory but confirming uptrend. | RSI near oversold territory but confirming downtrend. |
| False Breakout Risks | Weak breakout with low volume may signal trend reversal. | Weak breakdown with low volume may signal reversal. |
How to Trade Bull Flag Pattern
A flag pattern can be informative for anticipating potential breakout price points for entering and exiting trades. The chart pattern can also be used for estimating how far the price may rise or fall. Understanding how to properly trade a bull flag requires careful attention to multiple factors, including pattern formation, volume confirmation, and risk management.
The price action for both bull and bear flags usually mirrors the pole's distance after a breakout or sharp reversal. This characteristic makes flag patterns particularly useful for setting realistic profit targets based on historical price movement within the same pattern.
During the consolidation phase of a bullish trend, the price would form a rectangular shape with an upper boundary resistance line and a parallel lower boundary support line. This consolidation typically occurs at a slight downward angle, representing a healthy pullback within the broader uptrend. The parallel lines that form the flag should be relatively tight, indicating that the consolidation is controlled and orderly.
Once the bull flag pattern is identified, traders locate the entry point. The breakout point is where the candle slices above the upper boundary of the flag, and this area serves as the entry point for buyers. Ideally, this breakout should be accompanied by increased trading volume, which confirms the strength of the move and reduces the likelihood of a false breakout. The target for the bull flag is the pole height percentage rise added to the breakout point, providing a mathematical approach to setting profit expectations.
To minimize potential losses, some traders may also place a stop-loss at the flag's base, the consolidation phase's lowest point. This will limit the potential losses if the price moves against the trade. The stop-loss placement is crucial for maintaining a favorable risk-reward ratio and protecting capital in case the pattern fails to play out as expected.
Some traders can use the height of the flagpole to set a profit target. To determine the profit target, traders need to measure the flagpole height from the bottom of the pole to the top of the pole and then add it to the breakout price. This method assumes that the momentum that created the initial pole will be replicated after the consolidation phase, driving prices higher by a similar magnitude.
How to Trade Bear Flag Pattern
To determine the entry point for sellers in a bear flag pattern, the pole height is subtracted from the breakout price. This occurs when the asset price slices below the lower boundary of the flag. Similar to bull flags, traders should look for increased volume on the breakdown to confirm the validity of the pattern and the strength of the bearish momentum.
To limit potential losses, some traders may put a stop-loss at the swing high of the flag, which is the highest point of the consolidation phase in case the asset moves in the opposite direction. This stop-loss placement protects traders from scenarios where the downtrend fails to continue and the price reverses upward.
To calculate the pole height, traders need to subtract the lowest point of the pole from the highest point of the pole. The consolidation phase for both bull flags and bear flags should ideally not surpass 50% of the flag pole. A retracement phase greater than 50% may indicate that the trend does not have the required strength to continue, and the pattern may fail or transform into a different chart pattern altogether.
Additionally, the retracement phase is typically around 38.2% from the swing high – the highest point of the pole. This percentage aligns with Fibonacci retracement levels, which many technical traders use to identify potential support and resistance zones.
When looking to enter a short position, some traders wait for confirmation of the downtrend rather than simply placing an order after the price breaks below the flag's support line. This can help to avoid false signals and potential losses. Confirmation might include waiting for a candle to close below the support line or for volume to increase significantly on the breakdown.
A stop-loss order can be used to limit losses should the price start moving in the opposite direction. Typically, traders may place the stop-loss order above the resistance line of the flag. This placement ensures that if the bearish pattern fails and the price reverses upward, the position is closed before significant losses accumulate.
Example Scenario
Suppose you're trading ETH/USDC on the daily chart, and you notice a bear flag pattern forming. The flag's lower line is $2,500, and the upper line is $2,800. This consolidation phase has formed after a sharp decline, creating the pole of the bear flag pattern.
As a conservative trader, you decide to set your profit target using the distance between the flag's parallel trend lines. In this case, the difference between the two lines is $300, so you add this amount to the price at the breakout entry point, which is $2,400. This calculation method provides a conservative estimate based on the consolidation range rather than the full pole height.
Therefore, your price target is $2,700. This target represents a realistic expectation based on the pattern's structure and provides a clear exit point for taking profits.
To manage your risk, you may place a stop-loss order above the resistance line of the flag at, say, $2,900. If the price moves in the opposite direction, your stop-loss order will be triggered, limiting potential losses. This risk management approach ensures that your maximum loss is defined before entering the trade, allowing you to calculate your risk-reward ratio and make informed decisions about position sizing.
In this example, the risk would be approximately $500 per unit (from entry at $2,400 to stop-loss at $2,900), while the potential reward would be $300 per unit (from entry at $2,400 to target at $2,700). While this presents a risk-reward ratio of approximately 1:0.6, which may not be ideal, traders might adjust their strategy based on other factors such as market conditions, additional confirmation signals, or alternative profit target calculations using the full pole height.
Flags vs. Pennants
It is common for traders to confuse flag patterns with pennants, another type of continuation pattern that suggests the trend will likely continue after consolidation. While these patterns share similarities and both serve as continuation patterns, understanding their differences is important for accurate pattern recognition and trading decisions.
Like flags, pennants also include a flag pole. The pole formation is essentially identical in both patterns, representing a strong, sharp move in one direction accompanied by high volume. While flags have a rectangular consolidation phase with parallel trend lines, pennants form a triangular shape, with two converging lines creating the consolidation period.
The key distinction lies in the consolidation phase structure. In a flag pattern, the consolidation occurs within parallel lines, suggesting a more orderly and controlled pause in the trend. In a pennant pattern, the converging lines indicate that the price range is narrowing over time, with both support and resistance levels moving toward each other. This convergence typically suggests that volatility is contracting and a significant move is imminent.
Both patterns are considered reliable continuation patterns when they appear in the context of a strong trend, but pennants generally form over a shorter time period than flags. Traders should be aware of these differences to properly identify which pattern they are observing and adjust their trading strategies accordingly.
Avoiding False Signals From Flag Patterns
Bull flags and bear flags can serve as valuable tools in technical analysis to determine target prices in trending markets. However, they do not guarantee the projected return, as false breakouts can occur. A false breakout happens when a crypto asset breaks through the critical boundary of the flag but then quickly retraces, potentially triggering stop-losses and causing losses for traders who entered positions based on the initial breakout.
Traders should first identify whether there is a consistent trend. This could be indicated by a bull flag appearing in a market with accelerating interest or a bear flag forming in a trend with weakening momentum. Without a strong underlying trend, flag patterns are less reliable and more likely to fail. Examining the broader market context, including higher timeframe trends and overall market sentiment, can help confirm whether the conditions are favorable for flag pattern trading.
Volume is also crucial, as strong moves usually accompany a breakout. When a price breaks out from a flag pattern with low volume, it suggests weak conviction among market participants and increases the likelihood of a false breakout. Conversely, a breakout accompanied by significantly increased volume indicates strong participation and commitment to the move, making the pattern more reliable.
Note that traders often use indicators together. The Relative Strength Index is commonly used with bull and bear flags to gauge how overbought or oversold a crypto asset is. For bull flags, an RSI reading that is elevated but not extremely overbought can confirm that the uptrend has strength without being overextended. For bear flags, an RSI reading that shows bearish momentum without being extremely oversold can confirm the pattern's validity.
Additional confirmation tools might include moving averages, MACD (Moving Average Convergence Divergence), and support/resistance levels from previous price action. By combining multiple indicators and confirmation signals, traders can significantly reduce the risk of acting on false breakouts and improve their overall trading success rate with flag patterns.
Final Thoughts
Mastering bull and bear flags can provide traders with a valuable edge in identifying potential breakout opportunities in trending markets. These continuation patterns represent some of the most reliable tools in technical analysis when properly identified and traded within the context of strong trends.
While these continuation patterns offer insights into price momentum and possible entry and exit points, they should not be used in isolation. Combining flag patterns with other indicators, such as trading volume and the Relative Strength Index, can help traders confirm trends and minimize the risk of false breakouts. The integration of multiple analytical tools creates a more robust trading strategy that accounts for various market dynamics.
As with all trading strategies, risk management remains crucial: setting stop-loss orders and maintaining disciplined position sizing can help mitigate losses. Proper risk management ensures that even when patterns fail or false breakouts occur, the impact on overall trading capital remains manageable. Traders should never risk more than a small percentage of their capital on any single trade, regardless of how confident they are in a pattern.
By understanding the nuances of these patterns and integrating them into a broader trading plan, users can navigate crypto markets with greater confidence. Success in trading flag patterns comes from consistent application of identification criteria, patient waiting for proper setup conditions, disciplined execution of entry and exit strategies, and continuous learning from both successful and unsuccessful trades. As traders gain experience with these patterns across different market conditions and timeframes, their ability to recognize high-probability setups and avoid false signals will improve, potentially leading to more consistent trading results in the dynamic cryptocurrency market.
FAQ
What are Bull Flags and Bear Flags? What is their formation principle?
Bull flags form during uptrends as brief consolidation patterns after sharp price increases, featuring a flagpole followed by a downward-slanting channel. Bear flags appear during downtrends as rebound consolidations, signaling continued downward pressure. Both predict trend continuation when price breaks the channel boundaries.
How to identify and confirm bull flag and bear flag patterns on cryptocurrency charts?
Bull flags appear as parallel channels after sharp uptrends, with breakouts above resistance indicating continuation. Bear flags form after sharp declines with parallel channels, where breakdowns below support signal further downside. Look for reduced trading volume during consolidation phases.
What is the best entry point and exit strategy when trading bull flags?
Best entry is at the neckline breakout after the flag consolidation completes. Exit when price reaches the projected target(calculated from pole height)or when volume decreases significantly, signaling weakening momentum.
When trading bear flags, how should you set stop losses and price targets?
Set stop loss at Fibonacci 0.618 level. Target price should be placed beyond the flag top. Adjust both based on specific pattern characteristics and your risk tolerance.
What is the difference between Bull and Bear Flags and other technical patterns such as triangles and rectangles?
Bull and Bear Flags are trend continuation patterns with directional bias, while triangles and rectangles are consolidation patterns. Flags form after sharp price moves and break in the trend direction, whereas triangles and rectangles show price compression without predetermined direction.
What are the risks of trading flag patterns in the cryptocurrency market, and how should risk management be approached?
Flag pattern trading risks include false breakouts, whipsaws, and market volatility. Manage risk by using stop-loss orders, diversifying strategies, and analyzing volume changes during consolidation phases.

Beginner's Guide to Scalping Trading Strategies

Beginner's Guide to Bitcoin Margin Trading

What is scalping in trading and how to get started

Safe Guide to Margin Trading Cryptocurrencies

Beginner's Guide to Margin Trading: Starting with Bitcoin
Efficient Scalping Strategies for Crypto Trading

Who is Myron Golden: Crypto Thought Leader Profile
How Cheap Was Bitcoin and What It Means in the Modern Era

How to Flip 50 Dollars in Crypto

Pi Network Whitepaper Explained: Vision, Mining, and Tokenomics Unpacked

Pi Network Price Forecast for 2050: Long-Term Perspectives