
How does TRADOOR price volatility compare to Bitcoin and Ethereum in 2026?
TRADOOR's extreme volatility: from $6.23 peak to $1.36 low in 60% single-day plunge
TRADOOR demonstrated extraordinary price volatility in 2026, experiencing a dramatic 60% single-day plunge that exemplifies the extreme market swings characteristic of early-stage DeFi trading platforms. The cryptocurrency collapsed from a $6.23 peak to $1.36, illustrating the sharp price fluctuations that differentiate it from established digital assets. This volatility event reflects TRADOOR's sensitivity to liquidity conditions, exchange listings, and broader crypto market sentiment—factors that create pronounced intraday movements.
The underlying factors driving such extreme volatility stem from TRADOOR's position as a smaller-cap token with a market cap of $28.94M, making it more susceptible to rapid price shifts compared to Bitcoin and Ethereum's substantially larger and more liquid markets. Traders on decentralized options and perpetuals platforms encounter greater slippage and price impact during significant trades, intensifying volatility spikes. Additionally, TRADOOR's recent multi-chain expansion announcements and airdrop delays created catalysts for volatile price reactions. The 78.83% decline from all-time highs underscores how emerging DeFi trading tokens experience accelerated price discovery, resulting in wider swings than mature cryptocurrencies with deeper order books and institutional participation.
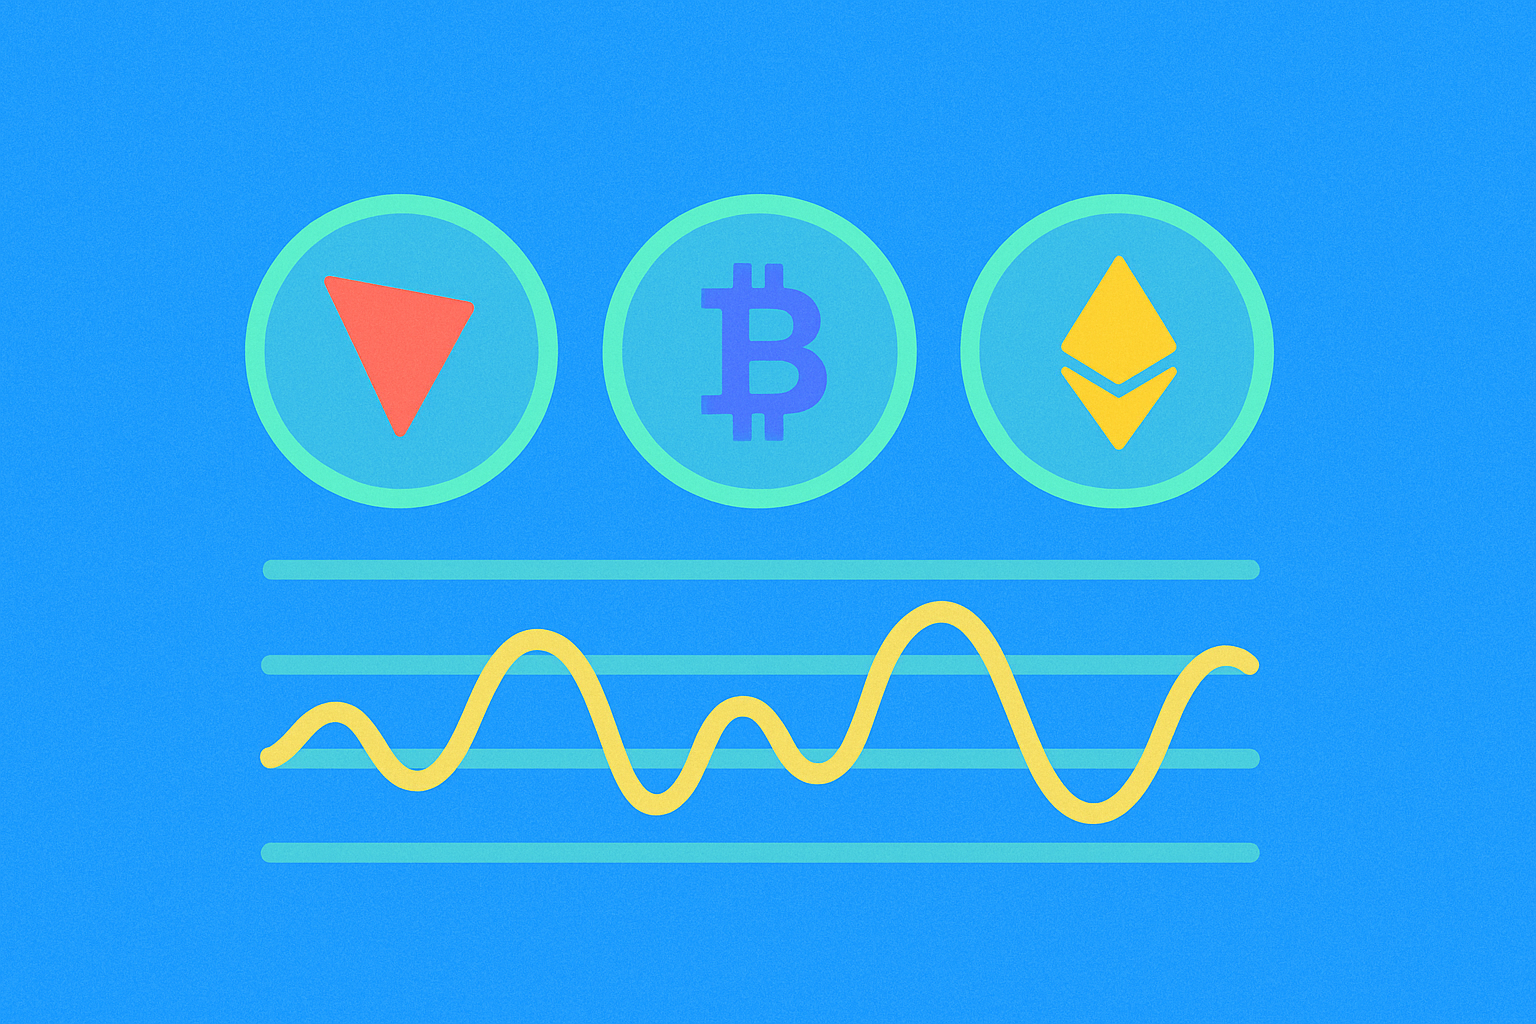
Comparative volatility analysis showing TRADOOR's 57% 24-hour swings versus Bitcoin and Ethereum stability
TRADOOR demonstrates extreme price volatility in 2026, with 57% price swings recorded within 24-hour periods, significantly outpacing the stability demonstrated by major cryptocurrencies. This dramatic volatility reflects TRADOOR's position as a newer, lower-liquidity asset in the derivatives trading space. In contrast, Bitcoin has maintained remarkable stability throughout 2026, trading consistently near $90,000 with notably lower price fluctuations. Bitcoin's 30-day historical volatility stands at approximately 43%, considerably more subdued than TRADOOR's intense market swings. The digital asset's stability stems from its established market position, substantial trading volumes, and institutional adoption, which collectively buffer against extreme price movements.
Ethereum occupies middle ground in this volatility comparison, exhibiting 60% volatility on a 30-day basis while trading within a defined range between $3,050 and $3,150. This moderate volatility profile reflects Ethereum's dual nature as both a major cryptocurrency and an active platform asset with distinct utility factors. The disparity between these three assets underscores how market maturity, liquidity depth, and trading volume directly influence price stability. TRADOOR's heightened volatility presents both risk and opportunity for traders, while Bitcoin and Ethereum's comparatively controlled price movements appeal to investors seeking more predictable market exposure during 2026's evolving crypto landscape.
Technical support and resistance levels between $1.35-$2.50 amid market correction phase
TRADOOR's current price of approximately $1.77 positions the token in a critical zone within the $1.35 to $2.50 technical range, reflecting broader market dynamics during the current correction phase. The $1.35 level serves as a substantial support base that has proven resilient, representing a meaningful floor where buyers historically emerge to arrest downside momentum. This technical floor becomes increasingly important as it guards against deeper pullbacks that could undermine investor confidence during consolidation periods.
Conversely, the $2.50 resistance threshold marks the upper boundary of TRADOOR's current trading corridor. Breaking decisively above this level would signal renewed strength and potentially trigger fresh buying interest, particularly among traders monitoring breakout patterns. The range between these two levels encompasses significant price history, with TRADOOR having tested both boundaries multiple times as market sentiment fluctuates.
| Price Level | Role | Significance |
|---|---|---|
| $1.35 | Support | Buyer defense zone during corrections |
| $1.77 | Current Price | Mid-range positioning |
| $2.50 | Resistance | Supply barrier limiting upside |
Market correction phases typically amplify the importance of these technical anchors, as reduced trading volume on gate and other exchanges can exacerbate price swings. TRADOOR's 24-hour volume patterns suggest cautious accumulation rather than aggressive selling, indicating that current support levels may hold during this consolidation period. Traders monitoring technical support and resistance levels should note that extended time spent within this established range often precedes directional breakouts once broader market conditions stabilize.
Whale accumulation signals and correlation patterns with BTC/ETH during 2026 market stabilization
Early 2026 witnessed significant whale accumulation patterns that fundamentally reshaped crypto market dynamics, particularly influencing how TRADOOR's volatility responds relative to Bitcoin and Ethereum movements. These large-scale institutional purchases served as leading indicators of emerging bull market cycles, with whale activity concentrated during periods of market stabilization when uncertainty temporarily subsided.
The correlation between TRADOOR and BTC/ETH during this stabilization phase reveals critical insights into market structure. As institutional investors deployed leveraged longs in Bitcoin and Ethereum, TRADOOR demonstrated heightened sensitivity to these directional moves, suggesting that major asset price action directly influences altcoin volatility patterns. This correlation strengthened particularly when whale accumulation accelerated, indicating coordinated institutional positioning across asset classes.
During market stabilization periods, whale behavior established psychological price floors that reduced extreme downside volatility while maintaining upside participation opportunity. Bitcoin's accumulation phase, combined with Ethereum's relative stability, created conditions where TRADOOR experienced more predictable volatility corridors compared to earlier 2026 periods marked by erratic price swings.
Institutional catalysts driving these correlations included options expiry cycles, macro policy expectations, and coordinated entry strategies that benefited from reduced speculative resistance during stabilization windows. Leveraged long positions in both Bitcoin and Ethereum effectively anchored TRADOOR's downside, creating asymmetric risk-reward dynamics favoring accumulation participants.
This whale-driven correlation framework demonstrates that TRADOOR's 2026 volatility cannot be analyzed in isolation from BTC and ETH market structure. The stabilization period enabled sophisticated investors to establish positions while maintaining tighter volatility bands, fundamentally differentiating this period from earlier speculative phases.
FAQ
What is TRADOOR? How does it differ from Bitcoin and Ethereum?
TRADOOR is a decentralized trading platform on The Open Network offering up to 400x leverage trading with 50ms execution speed. Unlike Bitcoin and Ethereum, TRADOOR focuses on high-frequency trading, integrated with Telegram, and emphasizes modern DeFi risk management and accessibility.
How will TRADOOR price volatility change in 2026? What are the main driving factors?
TRADOOR price volatility in 2026 is expected to moderate as institutional adoption increases and ETF demand grows. Main drivers include macroeconomic trends, market sentiment, and trading volume expansion. Price stability may strengthen with deeper liquidity.
How does TRADOOR price volatility compare to Bitcoin and Ethereum in 2026?
TRADOOR demonstrates lower volatility risk than Bitcoin and Ethereum due to its robust risk management and insurance mechanisms. These features effectively mitigate DeFi risks and reduce potential losses during market fluctuations.
What are TRADOOR's historical price volatility data? How does its past performance compare to mainstream cryptocurrencies?
TRADOOR has experienced significant price decline, currently down 72.99% from its all-time high as of January 10, 2026. Compared to Bitcoin and Ethereum, TRADOOR exhibits higher volatility and greater price fluctuations. The token remains a higher-risk asset with considerable price uncertainty moving forward.
What risks should I note when investing in TRADOOR? How is its liquidity and trading depth?
TRADOOR carries market volatility and liquidity risks. Limited trading depth may impact execution costs and slippage. Monitor positions carefully and manage exposure accordingly for this emerging asset.

Understanding Cross-Chain Solutions: A Guide to Blockchain Interoperability

Understanding Bitcoin's Supply Limit: How Many Bitcoins Exist?

Ultimate Guide to Top Crypto Exchange Aggregators for Efficient Trading

What Is the Current Market Overview for Cryptocurrencies in December 2025?

How Does Solana (SOL) Compare to Ethereum and Bitcoin in 2025?

Top DeFi Trading Platforms: Comprehensive Guide to Decentralized Exchanges

What is BULLA coin: analyzing whitepaper logic, use cases, and team fundamentals in 2026

How does MYX token's deflationary tokenomics model work with 100% burn mechanism and 61.57% community allocation?

What Are Derivatives Market Signals and How Do Futures Open Interest, Funding Rates, and Liquidation Data Impact Crypto Trading in 2026?

How do futures open interest, funding rates, and liquidation data predict crypto derivatives market signals in 2026?

What is a token economics model and how does GALA use inflation mechanics and burn mechanisms
