fomox
MarketsPerpsSpotSwap
Meme
Referral
More
Become a Smart Money on Tracker
Search Token/Wallet
/

How to Use MACD, RSI, and KDJ Technical Indicators for Crypto Trading: A Complete Guide

2026-01-13 04:07:06
Crypto Trading
Crypto Tutorial
Investing In Crypto
Spot Trading
Trading Bots
Article Rating : 4
115 ratings
This comprehensive guide equips crypto traders with advanced techniques for using MACD, RSI, and KDJ technical indicators effectively. Master MACD DIF/DEA crossovers and zero-line dynamics to identify reliable entry and exit points, reducing false signals through price action confirmation. Learn to detect overbought/oversold conditions using RSI (70-80 thresholds) and KDJ %K values, recognizing trend reversals when K exceeds 50. Discover how MACD histogram analysis validates breakout authenticity by detecting volume-price divergence patterns. The guide covers optimal parameter settings, golden cross strategies, and multi-indicator combination approaches specifically for volatile crypto markets on Gate. Perfect for traders seeking to improve accuracy by filtering low-probability trades through objective momentum confirmation and avoiding common pitfalls when relying solely on single indicators.
How to Use MACD, RSI, and KDJ Technical Indicators for Crypto Trading: A Complete Guide

MACD Crossover Signals and Zero-Line Dynamics: Reading DIF/DEA Transitions for Entry and Exit Points

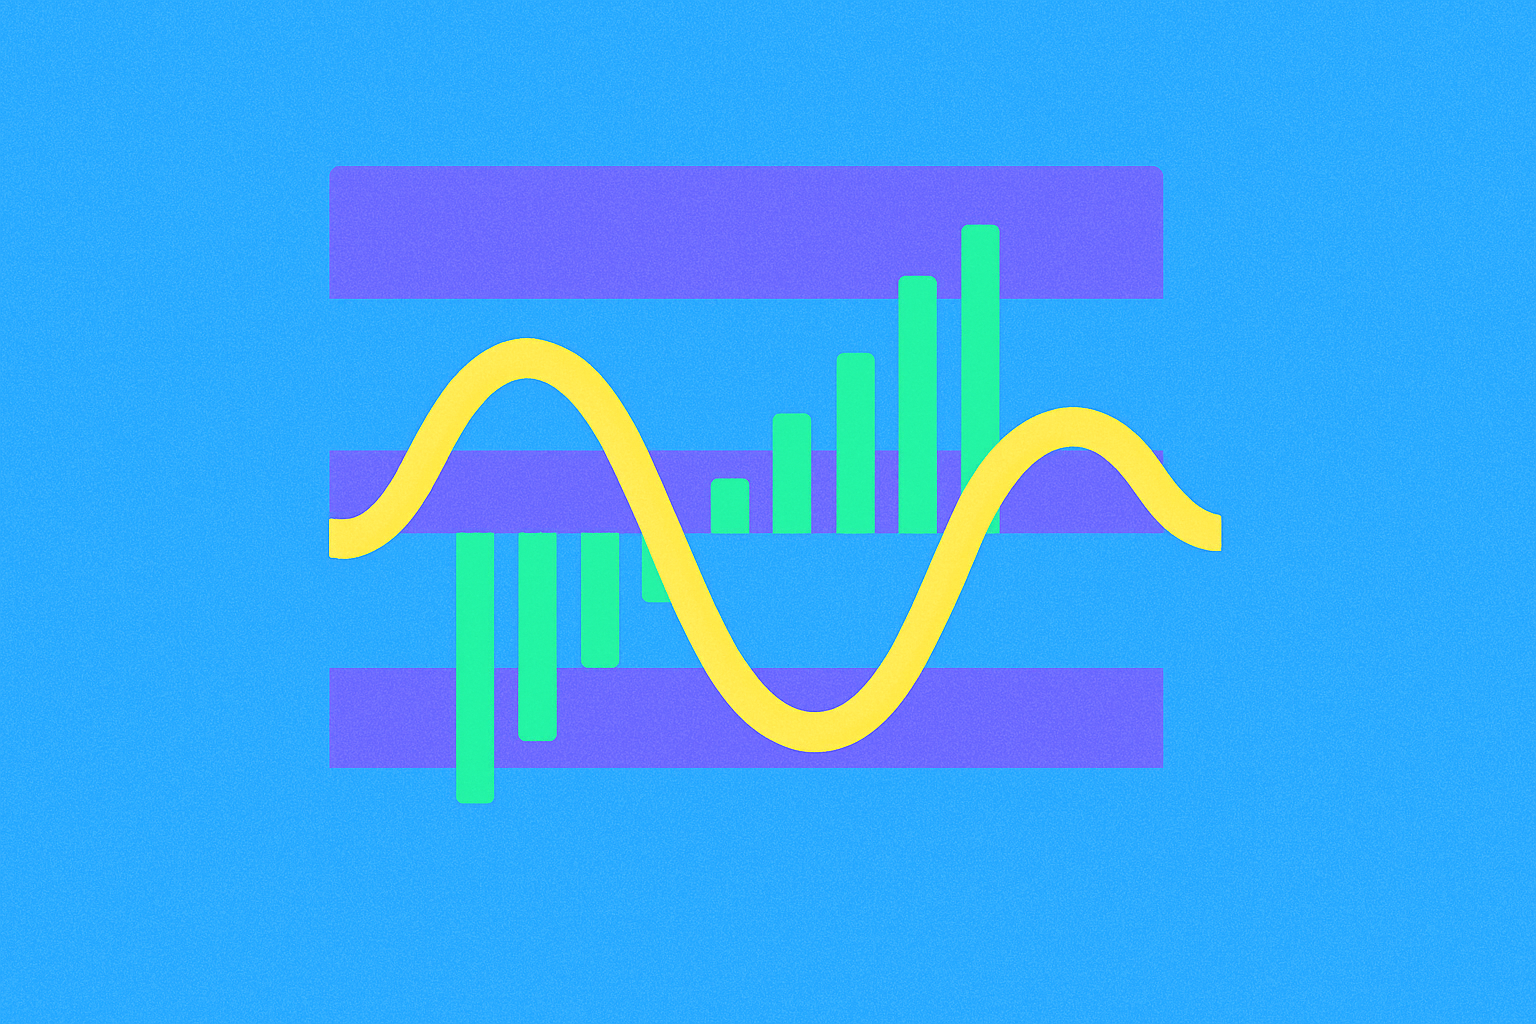
The MACD indicator consists of three components—the DIF (MACD line), DEA (signal line), and histogram—that work together to generate actionable trading signals for crypto traders. Understanding how these elements interact, particularly through DIF/DEA transitions, is essential for identifying reliable entry and exit points.

When the DIF crosses above the DEA, it produces a bullish crossover signal, suggesting upward momentum is building. Conversely, when the DIF crosses below the DEA, it generates a bearish signal, indicating potential downward pressure. These MACD crossover movements become especially significant when they occur in relation to the zero-line.

The zero-line acts as a critical reference point in MACD analysis. When the MACD histogram crosses above zero, it signals strengthening positive momentum and typically confirms bullish conditions. A position below the zero-line suggests bearish momentum dominance. By observing MACD zero-line dynamics, traders can gauge whether the market is in an uptrend or downtrend phase.

However, relying solely on MACD crossover signals can lead to false entries, particularly in ranging or choppy markets. Professional traders enhance their strategy by combining MACD DIF/DEA transitions with price action analysis, such as swing points and support/resistance levels. This confirmation approach significantly improves trade accuracy and reduces whipsaws.

For crypto trading on platforms like gate, timing your entries at MACD crossovers combined with price action confluence provides a more robust framework. Exit points similarly benefit from this dual approach—exiting when DIF/DEA crossovers align with price rejection levels increases profitability. Mastering these zero-line dynamics separates disciplined traders from those chasing indicator signals blindly.

RSI and KDJ Overbought/Oversold Levels: Identifying Trend Reversals When K-Values Exceed 50

Understanding overbought and oversold conditions through RSI and KDJ indicators is essential for identifying potential trend reversals in crypto trading. The RSI signals overbought territory when readings exceed 70-80, while oversold conditions typically appear below 30. Simultaneously, the KDJ momentum oscillator, which incorporates elements of the Williams Indicator and moving averages, provides complementary signals through its three components: the %K line, %D line as signal line, and %J line for additional decision-making context. When KDJ %K values exceed 50, this confirms an established uptrend, suggesting sustained buying pressure in the market. However, traders must watch for divergence patterns and crossover signals that precede actual trend reversals. A critical reversal signal occurs when the %J line crosses above 100 or drops below 0, indicating extreme overbought or oversold conditions. The %K and %D line crossovers, particularly death crosses or golden crosses, serve as early warning systems for potential price direction changes. By combining RSI readings with KDJ crossovers on platforms like gate, traders can construct more reliable reversal strategies, filtering false signals through multi-indicator confirmation. This dual-indicator approach enhances precision when timing entries and exits during volatile crypto market movements.

Volume-Price Divergence Detection: Confirming Breakout Authenticity Through Histogram Analysis

Volume-price divergence occurs when price movement fails to align with trading volume, often signaling weak or false breakouts. When an asset breaks above resistance on declining volume, the breakout authenticity becomes questionable. The MACD histogram serves as a powerful confirmation tool for identifying these divergences and validating genuine price movements.

The MACD histogram visually represents the difference between the MACD line and its signal line. During authentic breakouts, the histogram expands alongside price action, indicating strengthening momentum. Conversely, when price breaks higher but the MACD histogram contracts or fails to grow proportionally, traders receive a critical warning signal. This divergence suggests that although buyers pushed price upward, underlying momentum weakened—a common characteristic of false breakouts.

Effective traders use histogram analysis to filter low-probability trades before risking capital. When examining breakout scenarios across crypto markets on platforms like gate, confirming volume support through MACD histogram expansion significantly improves trade success rates. The histogram's directional strength—whether bars are growing or shrinking—provides objective evidence of whether the breakout possesses genuine buying pressure or represents temporary price extension destined to reverse.

FAQ

What are the characteristics of MACD, RSI, and KDJ technical indicators, and which market conditions are they suitable for?

MACD identifies trend direction through moving average crossovers, RSI identifies overbought/oversold conditions, KDJ identifies stochastic oscillations. MACD suits trending markets, RSI suits volatile markets, and KDJ suits range-bound markets.

How to correctly set MACD indicator parameters in cryptocurrency trading, and how to interpret MACD golden cross and death cross signals?

Use default parameters: EMA 12 and EMA 26. Golden crosses and death crosses have lag issues; prioritize price action instead. Focus on zero-axis crosses and momentum bar strength for better signals. MACD works best as confirmation, not primary entry signal.

What are the overbought and oversold levels for RSI indicator, and how should I use RSI to determine buying and selling timing for cryptocurrencies?

RSI overbought zone is 70-100, oversold zone is 0-30. Consider selling at overbought levels and buying at oversold levels. Combine with other technical indicators like MACD for better accuracy.

What are the advantages of KDJ indicator in short-term crypto trading, and what do K value, D value, and J value respectively represent?

KDJ identifies overbought/oversold levels effectively for short-term trading. K value is the fast line, D value is the slow line, and J value shows the deviation between K and D, helping traders judge market trends and entry/exit points.

How should I combine these three technical indicators to improve trading accuracy, and what are some common combination strategies?

Combine KDJ for trend identification, RSI for momentum strength, and MACD for price direction confirmation. Use KDJ signals as entry points, RSI for overbought/oversold conditions, and MACD for trend momentum. When all three align, trading accuracy significantly improves.

What are common pitfalls and risks to avoid when using technical indicators for crypto trading?

Avoid over-leveraging, using too many conflicting indicators, and blindly copying others' strategies. Ignore FOMO, stick to clear rules, maintain proper position sizing with stop-loss orders, and treat analysis as probability, not certainty. Test strategies on demo accounts first.

Are technical indicators reliable in highly volatile cryptocurrency markets, and how should I combine them with other analysis methods?

Technical indicators alone aren't entirely reliable in crypto's high volatility. Combine MACD, RSI, and KDJ with fundamental analysis, on-chain metrics, and market sentiment for comprehensive trading decisions. Multi-method approach reduces false signals significantly.

* The information is not intended to be and does not constitute financial advice or any other recommendation of any sort offered or endorsed by Gate.

Share

Content

MACD Crossover Signals and Zero-Line Dynamics: Reading DIF/DEA Transitions for Entry and Exit Points

RSI and KDJ Overbought/Oversold Levels: Identifying Trend Reversals When K-Values Exceed 50

Volume-Price Divergence Detection: Confirming Breakout Authenticity Through Histogram Analysis

FAQ

Related Articles
Effective Risk Management: Take Profit and Stop Loss Strategies in Trading

Effective Risk Management: Take Profit and Stop Loss Strategies in Trading

Discover how to use take profit and stop loss orders to manage risk effectively in crypto trading. Explore strategies for order placement and how to apply them to protect your capital on the Gate platform.
2025-12-03 13:56:50
Mastering Market Movements with Sell Stop Orders in Crypto Trading

Mastering Market Movements with Sell Stop Orders in Crypto Trading

This article offers insights into mastering crypto trading with sell stop market orders on Gate, optimizing risk management strategies. It outlines the mechanics of market, limit, and stop orders, explaining how sell stop market orders deploy precision and immediacy for minimizing losses. The piece distinguishes sell stop orders from stop losses, highlighting execution certainty versus price control. Traders can optimize strategies based on risk preference, understanding each order's potential and pitfalls. Key focus: practical applications for volatile markets and minimizing slippage impact.
2025-12-03 10:07:17
Exploring Virtual Trading in the Crypto World

Exploring Virtual Trading in the Crypto World

The article explores paper trading in the crypto market, highlighting its utility for learning without financial risk. It details its advantages for testing strategies and familiarizing users with trading platforms like Gate. Despite being risk-free, paper trading has limitations such as lacking emotional realism. Additionally, the article guides readers through setting up paper trading accounts and contrasts it with live trading, emphasizing its role in building confidence. Targeted at novice and experienced traders, it addresses needs for skill development and risk-free practice, making it an essential tool before live trading.
2025-10-30 11:02:06
Understanding the Fundamentals of Spot Trading

Understanding the Fundamentals of Spot Trading

This article delves into the world of spot trading in the cryptocurrency market, explaining its core mechanics, benefits, and limitations. It defines spot trading and contrasts it with crypto derivatives, offering insights suitable for both beginners and experienced traders. Key sections discuss the workings of centralized and decentralized exchanges like Gate, the differences with OTC trading, and the inherent risks involved. Ideal for newcomers seeking simplicity and direct asset ownership, the piece is structured to enhance understanding through clear segmentation and optimized keyword use for fast reading.
2025-11-16 07:18:00
Effective Take-Profit Strategies for Successful Trading

Effective Take-Profit Strategies for Successful Trading

Master the art of successful crypto trading using proven take-profit strategies, whether you're a beginner or an expert. Discover how to accurately set take-profit and stop-loss orders on the Gate platform to maximize your returns and minimize risk.
2025-11-22 08:07:04
How to Use MACD, RSI, and Bollinger Bands for Crypto Technical Analysis in 2025

How to Use MACD, RSI, and Bollinger Bands for Crypto Technical Analysis in 2025

The article explores essential technical analysis tools—MACD, RSI, and Bollinger Bands—providing crypto traders with strategies for identifying market extremes in 2025. It emphasizes the combined use of these indicators for enhanced accuracy in trend reversal detection. Additionally, the piece discusses Golden Cross and Death Cross strategies to confirm market trends, underscoring their application in trending environments. Lastly, it delves into volume-price divergence analysis for preempting major price movements, offering traders insights into market sentiment shifts. Geared towards crypto traders, the article enhances decision-making in volatile markets.
2025-12-20 01:23:23
Recommended for You
What Is the Best Time for Crypto Trading in India? A Complete Guide

What Is the Best Time for Crypto Trading in India? A Complete Guide

Cryptocurrency trading operates 24/7, but optimal timing significantly impacts execution quality and profitability for Indian traders. This comprehensive guide reveals that the 6 PM to 1 AM IST window—capturing the Europe-US market overlap—delivers peak liquidity, tighter spreads, and cleaner technical setups ideal for day traders and scalpers. The article breaks down how global sessions influence crypto markets across Asia, Europe, and the United States, then maps these patterns to IST for Indian traders' advantage. Different strategies require different conditions: day traders benefit from high-volatility evening windows, swing traders can extend hours for multi-hour trends, while long-term investors employ dollar-cost averaging regardless of timing. The guide debunks common myths about 24/7 trading superiority and provides actionable insights on using Gate exchange, volume indicators, and volatility tools to optimize entry and exit points. Success depends on matching trading hours to your personal risk tol
2026-01-13 07:03:48
How does WEMIX compare to competing blockchain platforms in market share and transaction fees?

How does WEMIX compare to competing blockchain platforms in market share and transaction fees?

This article provides a comprehensive comparison of WEMIX against leading blockchain platforms including Ethereum, Solana, and Polygon, focusing on market share positioning and transaction fee structures. WEMIX demonstrates significant competitive advantages through its SPoA consensus mechanism, delivering faster transaction finality and lower fees comparable to Solana and Polygon while maintaining superior decentralization through its 40 Node Council Partners governance model. The platform differentiates itself via advanced zk-rollup technology and cross-chain interoperability capabilities, enabling seamless multi-blockchain operations. Current market analysis reveals WEMIX holds 0.0062% market dominance with steady ecosystem growth, including 23% active address expansion in Q4 2025. Ideal for developers and users seeking cost-efficient, high-throughput blockchain infrastructure, particularly in gaming and DeFi applications, WEMIX positions itself as a comprehensive alternative to isolated network solutions
2026-01-13 07:02:05
How do macroeconomic factors and Fed policy impact cryptocurrency prices in 2026?

How do macroeconomic factors and Fed policy impact cryptocurrency prices in 2026?

This article examines how macroeconomic factors and Federal Reserve policy shape cryptocurrency valuations in 2026. It analyzes three primary transmission channels: Fed interest rate adjustments and quantitative measures that enhance market liquidity and reduce borrowing costs; inflation data and USD strength dynamics that create real-time price correlations; and traditional market volatility spillovers from S&P 500 and gold fluctuations that serve as predictive indicators. The piece demonstrates that the Fed's January 2026 rate pause and December 2025 quantitative tightening reversal have created supportive conditions for digital assets. Through comprehensive FAQ analysis, it equips investors and traders with practical frameworks for understanding how monetary policy shifts, inflation trends, and macroeconomic cycles directly influence Bitcoin, Ethereum, and broader crypto market performance on Gate and other major platforms throughout 2026.
2026-01-13 06:57:29
What is Cryptocurrency Compliance and Regulatory Risk: A Complete Guide to SEC Regulations, Audit Transparency, and KYC/AML Policies

What is Cryptocurrency Compliance and Regulatory Risk: A Complete Guide to SEC Regulations, Audit Transparency, and KYC/AML Policies

This comprehensive guide explores cryptocurrency compliance and regulatory risk across three critical domains. The article examines the SEC regulatory framework governing securities compliance, demonstrating how enforcement patterns have shifted toward fraud-focused oversight rather than aggressive digital asset regulation. It identifies audit transparency gaps as a major compliance vulnerability for crypto platforms, highlighting custody and disclosure deficiencies that trigger regulatory scrutiny and substantial penalties. The guide details KYC/AML implementation challenges that exchanges face, emphasizing how compliance failures directly impact market stability and operational viability. Through practical insights and regulatory analysis, this resource equips cryptocurrency platforms and projects with essential knowledge to navigate SEC requirements, establish robust audit practices, and implement effective KYC/AML policies—ensuring sustainable compliance and long-term market credibility in an increasingly
2026-01-13 06:53:23
What is WeFi (WFI) market overview: price, market cap, trading volume and liquidity in 2026

What is WeFi (WFI) market overview: price, market cap, trading volume and liquidity in 2026

WeFi (WFI) is a decentralized finance token trading at $2.66 with a market capitalization of $203.58 million and a global ranking of #5397. The token demonstrates solid market fundamentals with $1.97 million in 24-hour trading volume across major exchanges including Gate, supported by 75.29 million circulating tokens against a 1 billion maximum supply cap. WeFi's controlled tokenomics and moderate distribution strategy reduce selling pressure while maintaining adequate liquidity for traders. With 135% gains over the past 90 days, WeFi showcases strong investor confidence in its DeFi infrastructure positioned on BNB Smart Chain. This article provides a comprehensive overview of WeFi's price performance, market positioning, and tokenomics structure for investors evaluating cryptocurrency opportunities.
2026-01-13 06:51:04
How does on-chain data analysis reveal Virtuals Protocol's market potential in 2025?

How does on-chain data analysis reveal Virtuals Protocol's market potential in 2025?

This article leverages on-chain data analysis to assess Virtuals Protocol's market potential throughout 2025. By examining active addresses, transaction volumes, and whale concentration patterns, the analysis reveals genuine ecosystem adoption beyond speculative trading. Key metrics include the $770 million trading volume surge, 38 million cumulative interactions, and $135.5 million daily capital inflow, demonstrating substantial protocol utilization. The article explores how whale accumulation signals institutional confidence while network fee dynamics reflect growing demand for decentralized AI agent infrastructure. These verifiable on-chain indicators transform narrative claims into measurable proof of Virtuals Protocol's positioning within the emerging $52 billion AI agent economy. Readers will gain concrete frameworks for evaluating ecosystem health, understanding adoption trajectories, and assessing long-term viability through quantifiable blockchain metrics.
2026-01-13 06:49:13