What are the key derivatives market signals predicting crypto price movements in 2026: funding rates, open interest, and liquidation data

Funding rates turning negative signal growing short dominance and potential reversal opportunities in 2026
Negative funding rates represent a critical market signal where short traders are paying long traders to maintain their positions in perpetual futures contracts. This reversal in payment direction occurs when bearish sentiment dominates, causing shorts to outnumber longs significantly. As short dominance accumulates through derivatives markets, it creates conditions for potential reversals. When excessive short positioning develops, markets become increasingly vulnerable to squeeze events—situations where rapid price movements force short traders to liquidate positions, triggering sharp rallies. Professional traders monitor negative funding rates as early warning indicators precisely because they highlight unsustainable market extremes. The data shows that while institutional optimism wanes and technical weakness persists, extreme negative funding rates on platforms like gate often precede notable bounces. Traders recognize that when funding rates turn deeply negative, the reward structure incentivizes shorts, but simultaneously signals crowded bearish positioning. This crowding creates opportunities for reversal trades when technical bounce patterns align with fundamental shifts in market sentiment. Understanding this derivatives signal alongside liquidation data and open interest levels provides a comprehensive view of where price movements might develop next in 2026's volatile landscape.
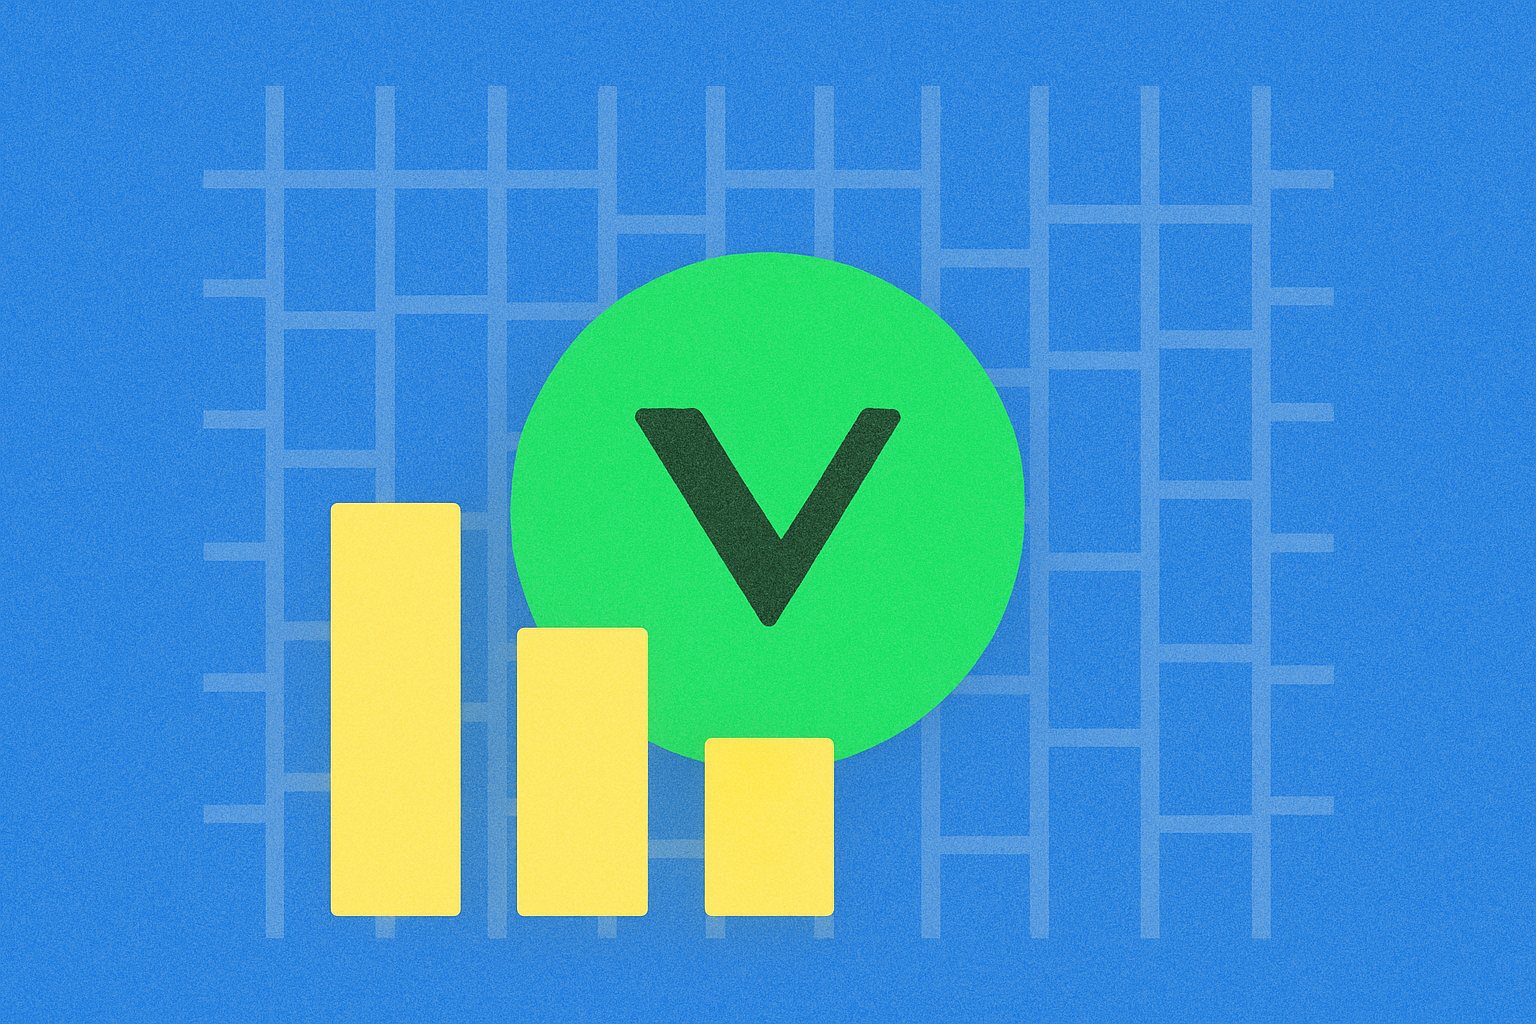
Open interest surge above $300 million demonstrates increased trader positioning for volatile price movements
The $300 million threshold in futures markets represents a critical inflection point where institutional and retail traders significantly increase their derivative positions. This metric serves as a powerful market signal, reflecting collective expectations about forthcoming price volatility. When open interest reaches such levels, it indicates that traders are building concentrated directional or hedging positions, anticipating substantial market movement in the near term.
During early 2026, Dogecoin's derivatives market exemplified this pattern, with open interest climbing steadily and eventually exceeding $1.5 billion by Q1. This expansion demonstrated how traders systematically increased their leverage exposure as bullish sentiment strengthened. The correlation between rising open interest and subsequent price appreciation proved particularly notable, as the 30% price surge in early 2026 coincided directly with accelerating futures positioning.
Elevated open interest above historical averages fundamentally alters market microstructure. With larger notional values locked into derivative contracts, even modest price fluctuations can trigger cascading liquidations, amplifying volatility. This dynamic creates self-reinforcing cycles where initial price movements generate margin calls, forcing position closures that push prices further in their original direction. Consequently, analyzing open interest levels provides traders with crucial insights into the leverage backdrop supporting or constraining volatile price movements.
Liquidation cascades and exchange inflows reveal distribution pressure despite technical recovery attempts
Recent derivatives activity reveals a critical divergence between price action and underlying market health. When DOGE surged 30% in early 2026, reaching $0.15, this technical recovery triggered over $1 million in long liquidations within hours. Exchange inflows of $2.3 million couldn't sustain the momentum, signaling that institutional buying pressure remains insufficient to drive lasting gains.
More dramatically, a liquidation cascade wiped out $2.05 million in long positions within a single hour, creating a 165,815% liquidation imbalance—among the most extreme readings for the meme cryptocurrency. This disparity between bullish price recovery attempts and massive liquidation events underscores persistent distribution pressure rather than genuine accumulation.
The mechanics are revealing: while technical charts show higher highs, derivatives data exposes the fragility beneath. Exchange inflows that temporarily spike during rallies quickly reverse, indicating smart money positioning for downside moves rather than sustainable uptrends. Trading volume declined 41% during liquidation spikes, demonstrating that price gains occurred on diminishing participation—a classic distribution pattern.
This dynamic has profound implications for 2026 price predictions. Liquidation cascades serve as leading indicators of directional exhaustion, particularly when they coincide with modest exchange inflows. The presence of distribution pressure—characterized by sustained selling into bounces—suggests that despite technical recovery attempts, market structure remains bearish. For traders monitoring derivatives signals, these liquidation patterns and exchange inflow reversals provide concrete early warnings that price rallies lack conviction, making them crucial components of comprehensive market analysis.
FAQ
What is funding rate (Funding Rate) and how does it reflect market sentiment and price movements?
Funding rate is a periodic payment between traders that reflects market sentiment. Positive rates indicate long dominance, negative rates indicate short pressure. It reveals leverage congestion, risk accumulation, and potential reversal signals when combined with price action and open interest analysis.
What does an increase or decrease in Open Interest (OI) mean for cryptocurrency prices?
Rising OI with price increases signals bullish momentum and new capital inflow, suggesting upward price trends. Declining OI may indicate trend exhaustion or market consolidation. High OI with leverage amplifies volatility and liquidation risks, potentially triggering sharp price movements.
How to predict short-term price reversals through liquidation data (Liquidation Data)?
Monitor liquidation zones where large forced trades concentrate. High liquidation clusters at specific price levels signal potential reversals. When price approaches these zones, cascading liquidations can trigger sharp reversals. Combine liquidation heatmaps with order book depth to identify optimal entry and exit points for short-term trading.
When funding rates reach extremely high levels, what market risks does it usually signal?
Extremely high funding rates typically signal an overheated market with excessive leverage accumulation. This indicates extreme bullish sentiment among traders and signals high risk of forced liquidations and potential sharp price corrections.
In the market environment of 2026, will the prediction accuracy of these derivatives indicators change?
Yes, prediction accuracy will improve in 2026. Institutional hedging demand increases significantly, with derivatives data increasingly integrated into financial terminals. Enhanced data accuracy and market maturity will optimize signal reliability and forecasting precision.
When spot and derivative markets show divergent price signals, how should this be interpreted?
Price divergence between spot and derivatives markets often signals potential trend reversals. Traders monitor such divergences to anticipate market shifts. However, confirmation from additional indicators is essential for reliable trading decisions and market analysis.
What are the short-term and long-term impacts of large-scale liquidation events on cryptocurrency prices?
Large liquidations trigger sharp short-term price declines through cascading forced selling, but recovery occurs within 48-72 hours via institutional buying and market stabilization. Long-term trajectories remain unchanged as fundamental drivers persist unchanged.
How to build a more reliable prediction model by combining multiple derivatives indicators (funding rates, open interest, and liquidation data)?
Combine funding rates, open interest, and liquidation data to create a robust prediction model. High funding rates with concentrated open interest signal extreme leverage and market fragility. Monitor liquidation spikes as early reversal warnings. Integrate these three signals to identify market sentiment shifts, systemic risks, and price inflection points with improved accuracy.

What Are the Key Crypto Derivatives Market Signals in 2026: Futures Open Interest, Funding Rates, and Liquidation Data?

How Do Derivatives Market Signals Predict Crypto Price Movements?

How Do Derivative Market Signals Impact Crypto Trading in 2025?

How Do Crypto Derivatives Market Signals Predict Price Movements?

How Do Derivatives Market Signals Predict SPX Price Movements in 2025?

How do futures open interest and funding rates signal crypto derivatives market shifts?

Hamster Kombat Daily Cipher Code Guide: Unlock Your Bonus Rewards

How Many Pi Coins Are Mined Till Now?
Is ETH Mining Dead? Can You Still Mine Ethereum in Recent Years?

Can Avalanche Reach $10,000?
Why Is CVX Stock Down Recently: Key Factors Explained