
What are the key differences between competing cryptocurrencies in market cap and user adoption

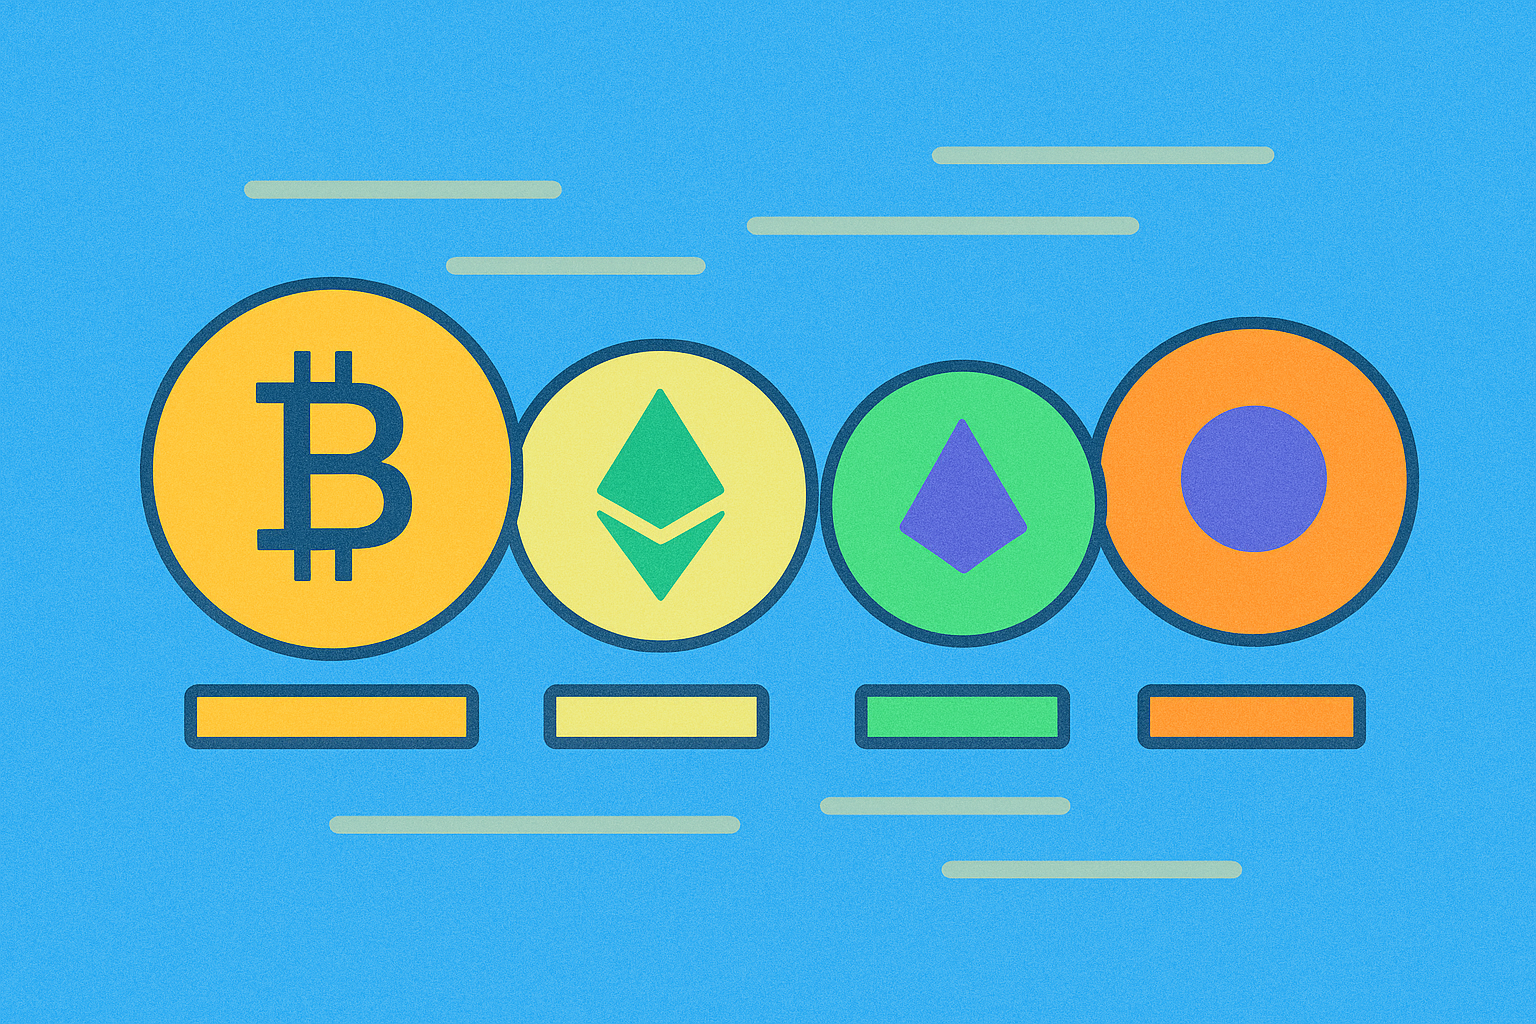
Market Capitalization Dominance: Bitcoin and Ethereum Command Over 60% of Total Crypto Market Value
The concentration of cryptocurrency market value among Bitcoin and Ethereum reflects their foundational roles in establishing digital asset infrastructure. Bitcoin, commanding approximately 56.9% of the total market capitalization, maintains its position as the primary store-of-value cryptocurrency and market bellwether. Ethereum's 11.7% share stems from its pioneering smart contract platform and the extensive ecosystem built upon its blockchain. Together, these two cryptocurrencies represent over 60% of a $3.18 trillion total crypto market cap, demonstrating the enduring strength of first-mover advantages.
This market capitalization dominance creates a structural reality where Bitcoin and Ethereum's price movements significantly influence the broader cryptocurrency market sentiment. When Bitcoin's market cap fluctuates, the ripple effects cascade through altcoin valuations and overall market dynamics. Ethereum's dominance reflects investor confidence in programmable blockchain infrastructure, supporting thousands of decentralized applications and tokens. The stability of this 60% combined dominance, despite thousands of alternative cryptocurrencies competing for market share, illustrates how cryptocurrency market cap distribution favors established protocols with proven security records and network effects. This concentration pattern provides reassurance to institutional investors entering the crypto space while simultaneously highlighting the competitive challenges facing newer market entrants.
User Adoption Disparity: Bitcoin's Network Effects vs. Emerging Altcoins' Growth Trajectories
Bitcoin maintains significant network effects through its established institutional adoption and macroeconomic influence, yet this dominance is beginning to plateau as capital increasingly flows toward emerging altcoins. Throughout 2024-2025, Bitcoin's user growth accelerated substantially, driven by digital wallet adoption, regulatory acceptance, and institutional investments that positioned it as a mainstream financial instrument. The network effects created by Bitcoin's massive user base continue to reinforce its market position through consistent daily user acquisition and expanding merchant networks.
Emerging altcoins are simultaneously charting different growth trajectories, leveraging blockchain innovation and Web3 technologies to capture user attention. Unlike Bitcoin, which benefits from macroeconomic tailwinds and regulatory developments, altcoins gain traction through technological differentiation and cost-effective scaling solutions. The altcoin market witnessed significant user acquisition momentum in 2024-2025, with increased exchange liquidity enabling broader accessibility. While Bitcoin's network effects remain powerful, emerging altcoins demonstrate that user adoption pathways diverge—newer projects succeed through innovation-driven adoption rather than first-mover advantage alone. Social sentiment data reveals renewed market attention across both ecosystems in early 2026, indicating that Bitcoin's established network remains foundational while altcoins offer alternative growth narratives attracting investors seeking diversification beyond traditional cryptocurrency dominance.
Competitive Positioning: Performance Metrics and Market Share Shifts in 2025-2026
The competitive landscape of cryptocurrencies reveals significant market share shifts as investors reassess their positioning in 2025-2026. GMT, the governance token of StepN, exemplifies this trend with a fully diluted market cap of approximately $104.6 million and an active holder base of 78,429 users. While ranked 461st globally, GMT demonstrates meaningful user adoption within its niche move-to-earn ecosystem, reflecting how specialized utility tokens carve out distinct market segments.
Performance metrics indicate a strategic market realignment away from dominant technology-focused cryptocurrencies toward undervalued sectors offering differentiated value propositions. This competitive positioning shift benefits projects like StepN that combine practical utility with governance features. The token's dual functionality—enabling stakeholder participation through governance while supporting protocol operations—illustrates how performance metrics have evolved beyond simple market cap considerations.
Market share dynamics now emphasize user engagement depth and ecosystem sustainability rather than absolute valuation size. With 51.86% of GMT's maximum supply in circulation, the token maintains expansion potential while demonstrating measured tokenomics. This measured approach to competitive positioning reflects 2025-2026 investor preferences favoring cryptocurrencies with clear utility and sustainable adoption paths over speculative alternatives.
Differentiation Strategies: Layer-2 Solutions and Institutional Integration as Key Competitive Advantages
Advanced layer-2 solutions have emerged as a critical differentiator in the competitive cryptocurrency landscape, offering significant advantages in scalability and operational efficiency. Platforms that implement robust layer-2 technology can process transactions at substantially reduced costs while maintaining security and decentralization. This technological edge directly translates to improved user experience and broader market accessibility, positioning projects with sophisticated layer-2 infrastructure ahead of competitors in terms of transaction throughput and cost-effectiveness.
Complementing technical innovation, institutional integration has become equally vital for cryptocurrency market dominance. Strong partnerships with institutional players enhance credibility, expand market reach, and provide crucial liquidity infrastructure. When layer-2 solutions combine with institutional partnerships, the synergy creates powerful competitive advantages. Institutional investors require scalable, cost-efficient networks—precisely what advanced layer-2 technology delivers. This alignment between technical capability and institutional needs accelerates adoption rates and strengthens market positioning. Projects successfully merging these strategies demonstrate superior user adoption metrics and market performance compared to those relying on a single differentiation factor, fundamentally reshaping competitive dynamics within the cryptocurrency ecosystem.
FAQ
What are the market cap rankings and differences between Bitcoin, Ethereum, and other major cryptocurrencies?
Bitcoin leads with approximately 1.789 trillion USD, followed by Ethereum at 362.6 billion USD. Bitcoin dominates due to first-mover advantage and brand recognition, while Ethereum powers smart contracts and DeFi. Other major cryptocurrencies differ in technology, use cases, and adoption rates within the broader 4.0 trillion USD crypto market.
Which cryptocurrencies have the highest user adoption rates, and what are the differences in their adoption curves?
Bitcoin and Ethereum lead in user adoption. Bitcoin maintains steady, foundational growth as the first cryptocurrency, while Ethereum shows accelerating adoption driven by smart contracts and DeFi applications. Layer 2 solutions like Arbitrum are experiencing rapid adoption curves, expanding the ecosystem reach.
What factors cause certain cryptocurrencies to grow in market cap faster than others?
Key factors include token supply dynamics, market news and events, project fundamentals, protocol upgrades, transaction volume, adoption rate, and competitive advantages in technology or use cases.
What are the key differences between Bitcoin and Ethereum in market competition, including their respective advantages and disadvantages?
Bitcoin offers high liquidity and market dominance but faces high volatility. Ethereum excels in smart contracts and decentralized applications but has slower transaction speeds and higher gas fees compared to Bitcoin's simpler network architecture.
How do emerging cryptocurrencies compete with established coins like Bitcoin and Ethereum?
Emerging cryptocurrencies compete through differentiated use cases, faster innovation, and specialized features. While Bitcoin focuses on value storage and Ethereum on smart contracts, newer coins target specific niches like Layer-2 scaling, privacy, or gaming. Success depends on user adoption, transaction volume, developer ecosystem, and solving real problems rather than directly competing on market cap.
How to evaluate the competitiveness of cryptocurrencies through market cap, trading volume, and user activity?
Assess competitiveness by analyzing market cap for investor confidence, trading volume for liquidity and market interest, and user activity for adoption trends. Strong metrics across all three indicate robust market position and competitive strength.

Understanding Cross-Chain Solutions: A Guide to Blockchain Interoperability

Understanding Bitcoin's Supply Limit: How Many Bitcoins Exist?

How do futures open interest, funding rates, and liquidation data predict crypto derivatives market signals in 2026?

Ultimate Guide to Top Crypto Exchange Aggregators for Efficient Trading

What Is the Current Market Overview for Cryptocurrencies in December 2025?

How Does On-Chain Data Analysis Reveal Bitcoin Market Trends in 2025?

What is BULLA coin: analyzing whitepaper logic, use cases, and team fundamentals in 2026

How does MYX token's deflationary tokenomics model work with 100% burn mechanism and 61.57% community allocation?

What Are Derivatives Market Signals and How Do Futures Open Interest, Funding Rates, and Liquidation Data Impact Crypto Trading in 2026?

How do futures open interest, funding rates, and liquidation data predict crypto derivatives market signals in 2026?

What is a token economics model and how does GALA use inflation mechanics and burn mechanisms
