What are the top cryptocurrencies by market cap and trading volume in 2026
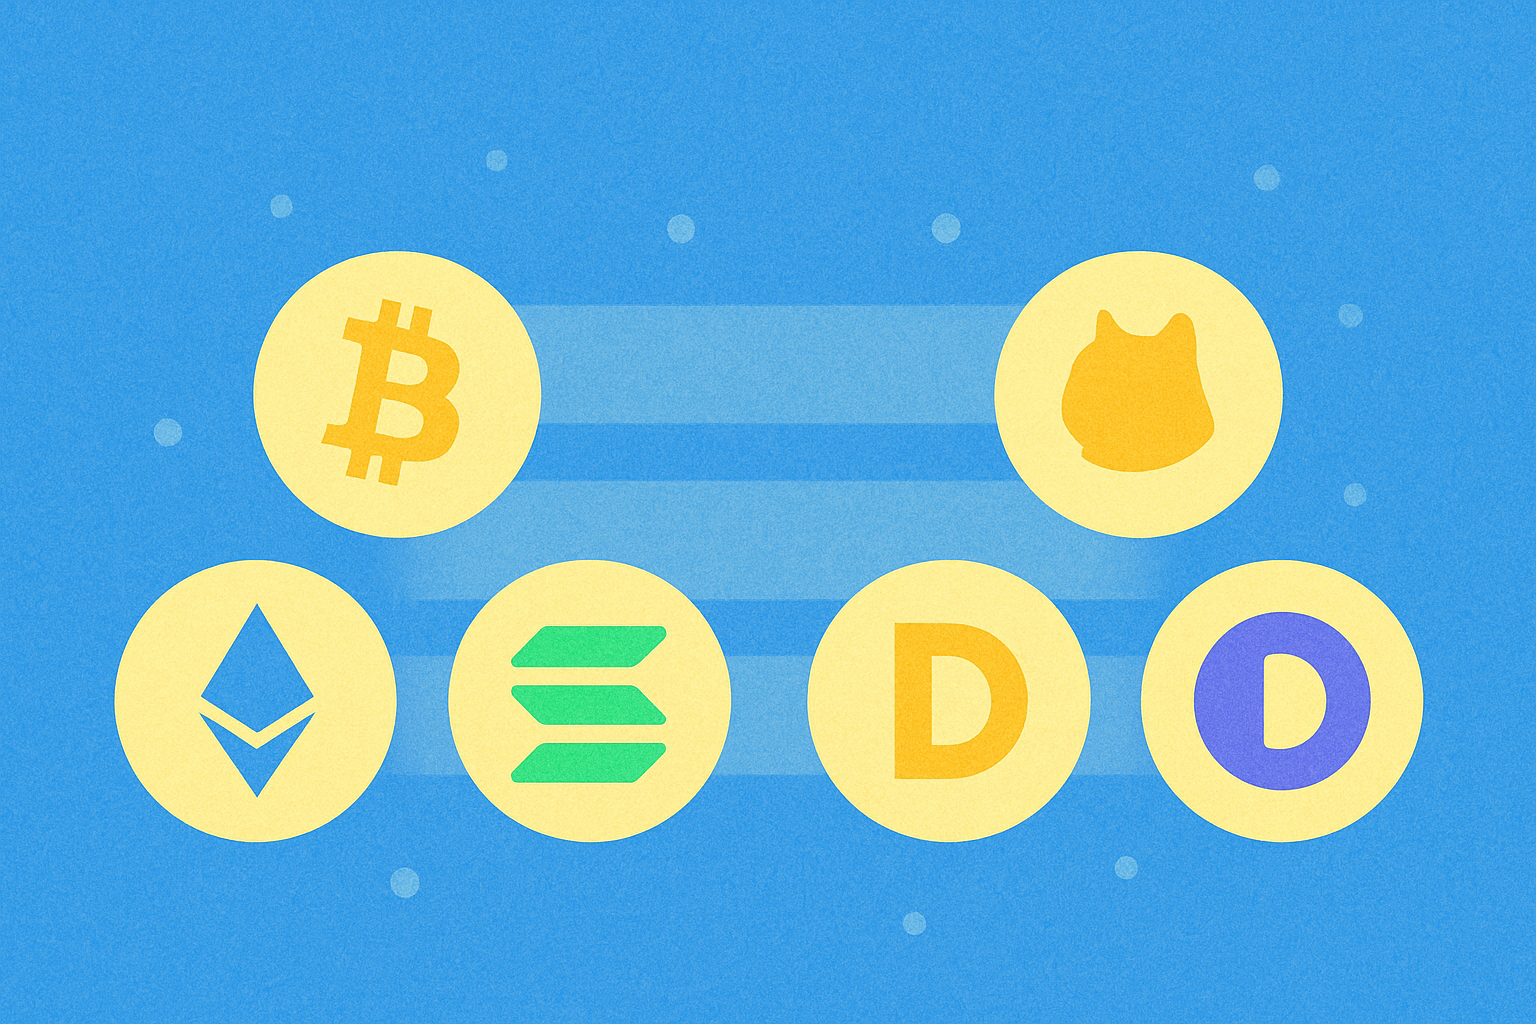
Top 5 cryptocurrencies by market cap: dominance analysis and ranking trends in 2026
Market capitalization serves as the principal metric for ranking cryptocurrencies globally, calculated by multiplying a coin's current price by its circulating supply. This approach reflects the total value locked in each asset and provides investors with reliable indicators for assessing market dominance. As of January 2026, the cryptocurrency landscape shows significant concentration, with leading assets commanding substantial portions of total market value while mid-tier cryptocurrencies maintain varying degrees of influence.
Trading volume complements market cap analysis by revealing liquidity and investor activity levels. Higher trading volumes typically indicate stronger market confidence and easier entry or exit points for traders. Dogecoin exemplifies this dynamic, currently ranking 10th by market cap with a valuation of $21.67 billion and maintaining a 0.66% market share. Its 24-hour trading volume of approximately $29.53 million demonstrates consistent market participation, supporting its position among major cryptocurrencies. The relationship between these metrics shows that cryptocurrencies maintaining substantial market cap often correlate with healthy trading volumes, creating virtuous cycles of market interest and liquidity that sustain their competitive rankings throughout 2026.
Trading volume and liquidity metrics: 24-hour and 7-day performance comparison
Understanding trading volume and liquidity metrics provides crucial insights into cryptocurrency market dynamics and price movements. The 24-hour trading volume represents immediate market activity and buying pressure, while the 7-day volume reveals broader market trends and sustained interest in a particular asset. For instance, Dogecoin demonstrated a 24-hour trading volume of approximately $29.5 million with a positive price movement of 1.31% during that period, indicating moderate short-term buying momentum.
When comparing these timeframes, traders observe how liquidity metrics fluctuate based on market sentiment and external events. Dogecoin's 7-day performance showed a decline of 6.05%, suggesting that despite recent positive 24-hour activity, longer-term selling pressure has accumulated. High trading volume paired with sustained price increases typically signals strong market confidence, whereas declining volume during downturns may indicate weakening conviction among participants.
Analyzing these metrics on platforms like gate reveals how major cryptocurrencies maintain varying liquidity profiles. Assets with robust 24-hour volumes combined with stable 7-day trends attract institutional traders seeking minimal slippage. The relationship between short-term and intermediate volume patterns helps investors identify whether price movements reflect genuine demand shifts or temporary market noise, making liquidity metrics indispensable for informed trading decisions.
Exchange coverage and supply dynamics: distribution patterns across major trading platforms
The accessibility of top cryptocurrencies depends significantly on their presence across multiple trading platforms and exchange coverage strategies. Dogecoin exemplifies this distribution model, being listed on 78 major exchanges worldwide, creating distribution patterns that facilitate global market participation. This extensive platform availability directly correlates with its daily trading volume of approximately $29.5 million, demonstrating how broad exchange coverage enhances liquidity.
Supply dynamics play a crucial role in determining where cryptocurrencies trade most actively. With 168.4 billion DOGE in circulation and a fully diluted market cap of $21.7 billion, Dogecoin's massive supply fundamentally shapes its exchange selection and trading intensity. Platforms like gate prioritize coins with strong liquidity profiles and established user bases, creating a self-reinforcing cycle. The interplay between circulating supply volume and market cap influences which exchanges feature a cryptocurrency most prominently in their trading pairs. Cryptocurrencies ranked among the top by market capitalization typically achieve broader platform coverage because institutional and retail traders seek venues offering optimal depth and spreads. Understanding these supply distribution patterns across major trading platforms reveals how market structure evolves, with leading cryptocurrencies maintaining presence across centralized exchanges, decentralized protocols, and regional platforms to maximize trading accessibility and minimize friction for users across different geographic markets.
FAQ
What are the top cryptocurrencies by market cap in 2026? How do Bitcoin and Ethereum maintain their market position?
Bitcoin remains the leading cryptocurrency by market cap, followed by Ethereum as the second-largest. Both dominate the market with Bitcoin's institutional adoption and Ethereum's smart contract ecosystem driving their positions. Stablecoins and Layer-2 tokens also rank highly in 2026.
What are the rankings of trading volume in the cryptocurrency market in 2026? Which cryptocurrencies are trading most actively?
Bitcoin, Ethereum, and Solana lead 2026 trading volume. Bitcoin dominates with 35% market share, Ethereum follows at 22%, while Solana, XRP, and Polkadot maintain strong activity. Stablecoins USDT and USDC drive significant daily volumes as trading pairs.
What are the advantages and risks of emerging cryptocurrencies compared to mainstream coins in 2026?
Emerging cryptocurrencies offer higher growth potential and innovation in blockchain technology. However, they carry greater volatility, lower liquidity, and higher risk of project failure compared to established mainstream coins with proven track records and stability.
How is the market cap ratio of Bitcoin, Ethereum, and other mainstream cryptocurrencies expected to change?
Bitcoin's dominance is projected to stabilize around 45-50%, while Ethereum may hold 15-18% market share. Emerging Layer 2 solutions and alternative chains will capture growing portions, fragmenting the remaining market cap among thousands of tokens as the ecosystem matures.
What are the main factors affecting cryptocurrency market capitalization and trading volume in 2026?
Key factors include regulatory clarity, institutional adoption, macroeconomic conditions, technological innovations in blockchain infrastructure, Bitcoin and Ethereum dominance, DeFi ecosystem growth, global geopolitical events, and mainstream consumer adoption rates.
How to evaluate cryptocurrency investment value through market cap and trading volume data?
Market cap indicates overall project scale and adoption level. High trading volume reflects liquidity and market interest. Compare market cap to trading volume ratio—higher ratios suggest stability. Analyze trends over time rather than snapshots. Strong fundamentals with growing adoption typically drive sustainable market cap growth and healthy trading volume, signaling stronger investment potential.

What Are the Top Crypto Coins by Market Cap in 2025: Current Rankings and Trading Volume

What Is the Current Crypto Market Cap Ranking and Trading Volume Overview in 2025?
What is the Current Crypto Market Overview: Rankings, Supply, Trading Volume, and Liquidity in 2025?
What Is the Current Crypto Market Cap Rankings and 24H Trading Volume Overview?

What Is Today's Crypto Market Cap Rankings and Trading Volume Overview?
What Are the Top Crypto Coins by Market Cap and Trading Volume in 2025?

Can Algorand Reach $20: An In-Depth Analysis

What is on-chain data analysis and how does it predict cryptocurrency price movements
Recursive Inscription

What Are the Biggest Cryptocurrency Security Risks: Smart Contract Vulnerabilities, Exchange Hacks, and Network Attacks Explained
Understanding Algorand's Price Dynamics