What factors drive cryptocurrency price volatility and how can traders identify support and resistance levels

Historical Price Trends and Volatility Patterns: Understanding cryptocurrency price movements across different timeframes and market cycles
Cryptocurrency price movements exhibit distinct patterns when examined across multiple timeframes, from hourly charts to yearly cycles. Short-term volatility typically shows rapid fluctuations driven by immediate market sentiment and trading activity, while longer timeframes reveal sustained trends shaped by macroeconomic factors and adoption cycles. For instance, analyzing daily and weekly price data reveals how brief pullbacks often occur within broader uptrends, allowing traders to distinguish between noise and meaningful directional shifts.
Market cycles significantly influence these volatility patterns. During bull markets, cryptocurrency price movements tend to show higher highs and higher lows over time, with dips attracting new buyers. Conversely, bear market phases demonstrate lower highs and lower lows, creating sustained downward pressure. By studying historical price data spanning multiple years, traders identify recurring cycle lengths and volatility intensities. A coin that experienced an 68% decline over one year but showed only 1.97% losses in recent 24-hour periods suggests different volatility regimes at play—yearly downtrends contrasting with period-specific stabilization.
Comparing volatility across timeframes provides context for identifying genuine trading opportunities. When shorter timeframe movements (hourly or daily) deviate significantly from longer-term trends, these divergences often signal potential reversals or consolidation zones where prices stabilize temporarily. Understanding these layered volatility patterns enables traders to anticipate where prices might pause before resuming their primary trend direction.
Support and Resistance Levels: Identifying key technical levels where price reversals typically occur and their predictive value for traders
Support and resistance levels serve as critical anchors in technical analysis, helping traders navigate the volatility inherent in cryptocurrency markets. These technical levels represent price points where buying or selling pressure intensifies, often triggering the reversals that characterize volatile markets. Support levels indicate prices where demand historically increases and downward momentum falters, while resistance levels mark where supply surges and upward movement encounters obstacles.
Traders identify these key technical levels through historical price data and chart patterns. By examining past market behavior, analysts spot recurring price zones where reversals consistently occur, creating predictable trading opportunities. For instance, reviewing HBAR price movements across recent months reveals distinct technical ranges—the cryptocurrency repeatedly bounced between $0.19 and $0.12 zones, establishing clear support and resistance boundaries that guided trading decisions.
The predictive value of support and resistance levels lies in their ability to forecast potential price direction changes. When price approaches a technical level, traders anticipate reversals with measurable probability. This predictive capacity transforms support and resistance from mere historical observations into actionable trading signals. Sophisticated traders use these levels to set stop-losses below support or take-profits near resistance, quantifying risk management through technical precision.
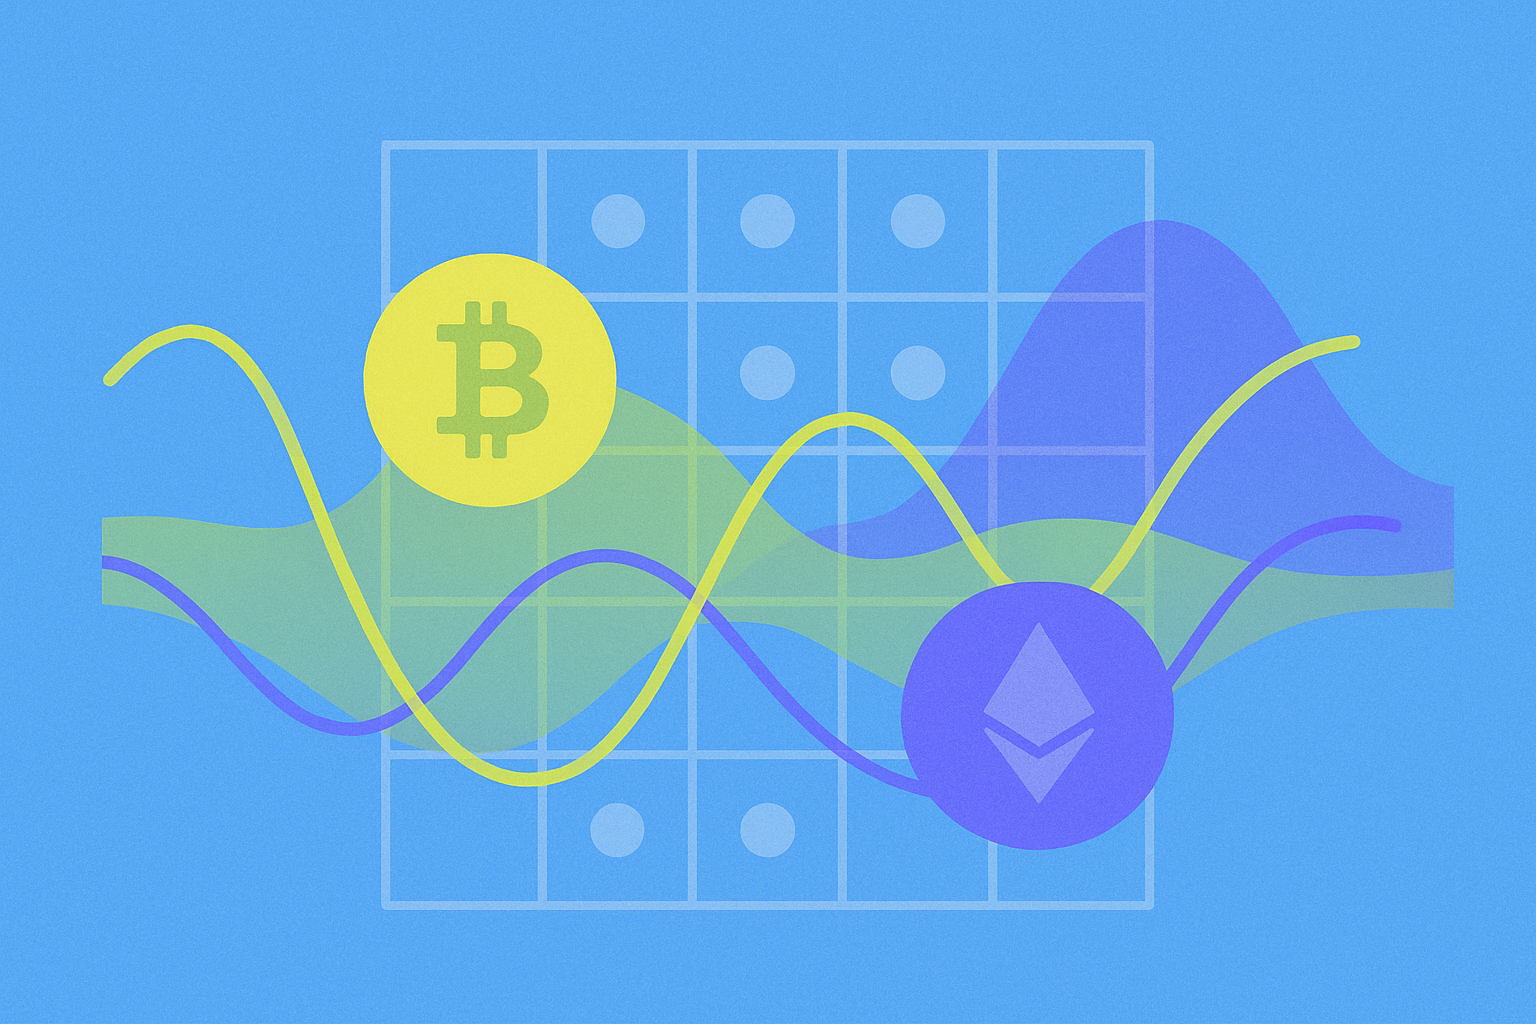
Correlation Analysis with BTC and ETH: Examining how altcoin price volatility moves in relation to Bitcoin and Ethereum movements
Altcoin price volatility frequently mirrors the directional movements of Bitcoin and Ethereum, creating predictable correlation patterns that traders can leverage. When Bitcoin experiences significant upward momentum, most altcoins typically follow suit, though often with amplified volatility. This phenomenon occurs because Bitcoin dominates market sentiment and capital allocation—many investors use Bitcoin as a barometer for overall cryptocurrency market health.
The relationship between Bitcoin, Ethereum, and altcoin price movements varies across different market conditions. During bull markets, altcoins tend to outperform in percentage gains but also suffer steeper declines during corrections. For instance, assets like Hedera have demonstrated this dynamic, with substantial 7-day to 1-year price swings reflecting broader market trends.
| Timeframe | Correlation Impact | Typical Altcoin Response |
|---|---|---|
| 1 Hour | Weak | Limited direct correlation |
| 24 Hours | Moderate | Clear price tracking |
| 7 Days | Strong | Pronounced volatility alignment |
| 1 Year | Strong | Significant trend following |
Traders identifying support and resistance levels should account for this Bitcoin-Ethereum correlation when analyzing altcoin price volatility. Understanding how Bitcoin movements initiate altcoin cascades enables more accurate resistance level placement and support identification. By monitoring Bitcoin and Ethereum price action alongside specific altcoins, traders can anticipate potential breakouts or breakdowns before they fully materialize in altcoin price charts.
Recent Price Fluctuations and Volatility Metrics: Analyzing current drawdown percentages and volatility rates to assess market risk exposure
Understanding current market conditions requires examining both recent price movements and quantifiable volatility metrics that indicate potential risk exposure. HBAR demonstrates notable short-term weakness, declining 1.97% over 24 hours and experiencing a more pronounced 11.72% drawdown across the seven-day period. The most dramatic volatility becomes evident when observing the one-year performance, with a significant 68.37% drawdown from previous highs, reflecting the broader challenges facing this cryptocurrency throughout the extended timeframe.
Calculating drawdown percentages provides actionable insights for risk management. From HBAR's historical peak of $0.569229 to the current price near $0.108, traders can identify an approximate 81% maximum drawdown, representing substantial volatility that demands careful position sizing. Current volatility rates, coupled with elevated market fear indicators registering "Extreme Fear" at 24 on sentiment scales, suggest heightened uncertainty affecting price discovery mechanisms.
| Timeframe | Price Change | Volatility Indicator |
|---|---|---|
| 24 Hours | -1.97% | Moderate |
| 7 Days | -11.72% | High |
| 1 Year | -68.37% | Extreme |
These volatility metrics underscore the importance of recognizing support and resistance levels during periods of pronounced price fluctuations. Traders assessing market risk exposure must factor in both recent drawdown patterns and the broader volatility environment when developing strategies on platforms like gate for cryptocurrency trading and risk management.
FAQ
What are the main macroeconomic factors that drive cryptocurrency price volatility?
Key macroeconomic factors include interest rate changes, inflation data, regulatory announcements, global economic conditions, and market sentiment. Additionally, Bitcoin and altcoin correlation with traditional assets, institutional adoption trends, and cryptocurrency trading volumes significantly influence price movements in crypto markets.
How do market sentiment and social media influence crypto price movements?
Market sentiment and social media drive crypto prices through collective investor psychology. Positive posts amplify buying pressure, while negative sentiment triggers sell-offs. Trending topics on Twitter, Reddit, and Discord can spark rapid price swings. FOMO and FUD dynamics create volatility as traders react to viral discussions rather than fundamentals.
What is the difference between support and resistance levels, and how do traders identify them?
Support levels are price floors where buying interest prevents further decline. Resistance levels are price ceilings where selling pressure limits upward movement. Traders identify them by analyzing historical price charts, noting repeated price touches, previous highs/lows, and using technical indicators like moving averages.
What technical indicators can help traders identify support and resistance zones?
Key indicators include Moving Averages for trend confirmation, Fibonacci Retracements for price levels, RSI for overbought/oversold conditions, and Volume analysis for strength validation. Bollinger Bands help identify volatility extremes, while Pivot Points provide dynamic support and resistance levels for precise entry and exit strategies.
How can traders use support and resistance levels to set stop-loss and take-profit orders?
Traders place stop-loss orders below support levels to limit losses if price breaks down. Take-profit orders are set above resistance levels to lock in gains when price rebounds. This strategy manages risk and secures profits at predetermined price points.
What is the relationship between trading volume and price volatility in cryptocurrency markets?
Higher trading volume typically amplifies price volatility, as large transactions move prices rapidly. Low volume can cause extreme price swings from smaller trades. Strong volume increases during support and resistance level breaks often signal sustained trend changes.
How do regulatory announcements and news events impact cryptocurrency prices?
Regulatory announcements and news events significantly influence cryptocurrency prices through market sentiment shifts. Positive regulatory clarity typically drives prices upward, while restrictive policies cause sharp declines. Major news regarding adoption, security breaches, or macroeconomic factors create rapid price movements as traders adjust positions based on perceived risk and opportunity.
What are common mistakes traders make when identifying support and resistance levels?
Common mistakes include ignoring market structure, using round numbers arbitrarily, failing to consider timeframes, neglecting volume confirmation, and over-relying on old levels. Traders often mistake temporary price touches for true support/resistance without confirming with transaction volume and market context.

What Are the Key Price Support and Resistance Levels for Crypto in 2025?

How Has Bitcoin's Price Volatility Changed in 2025?

# How Does Chainlink (LINK) Price Volatility Compare to Bitcoin and Ethereum in 2025?

How Has Cryptocurrency Price Volatility Evolved in 2025?
What Factors Are Driving the Current Cryptocurrency Price Volatility?

How Has BARD's Price Volatility Affected Its Market Performance in 2025?

How to Read Crypto Derivatives Market Signals: Futures Open Interest, Funding Rates, and Liquidation Data

How Does Federal Reserve Policy and Inflation Data Impact Cryptocurrency Prices

What are the key differences between competing cryptocurrencies in the same market segment

What is crypto exchange net flow and how does it impact token price movements

What is the current crypto market overview and why do market cap rankings, trading volume, and liquidity matter for traders in 2026