What is a token economic model: how does DASH balance 45% masternode, 45% miner, and 10% governance allocation?

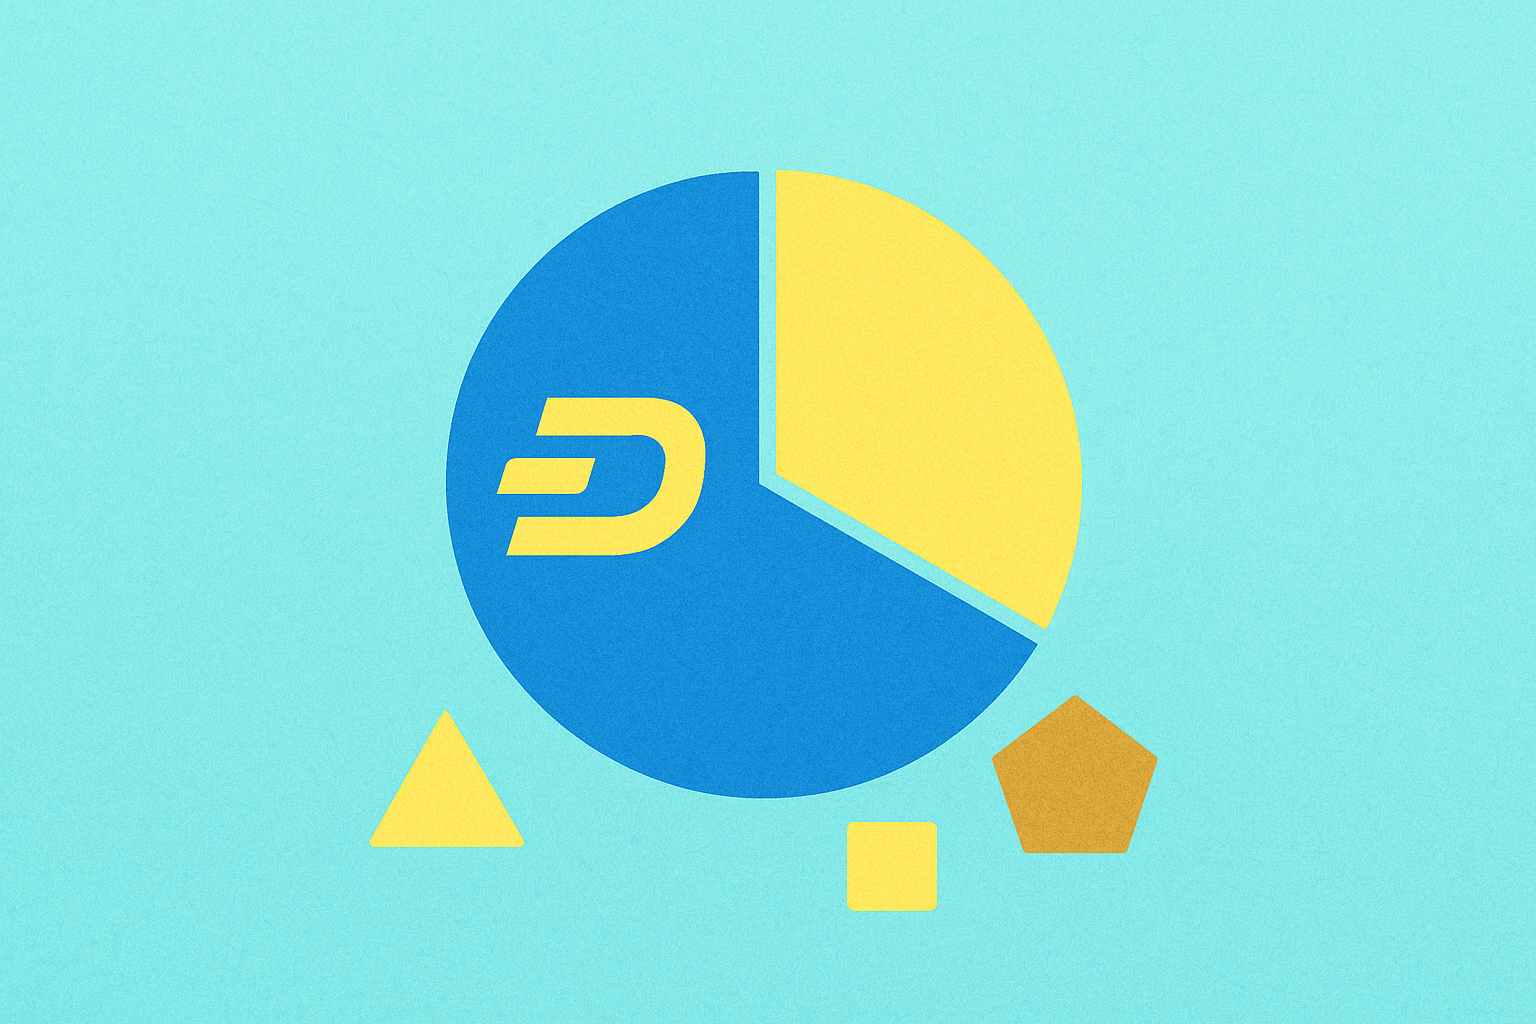
DASH's Three-Way Block Reward Split: 45% Masternodes, 45% Miners, 10% Governance Treasury
Dash's block reward architecture represents a sophisticated token economic model that fundamentally reshapes how blockchain incentives align network participants. Unlike traditional proof-of-work systems that concentrate rewards exclusively among miners, Dash distributes each newly created block across three distinct stakeholders through a carefully calibrated formula: miners receive 45% for securing the network through computational work, masternodes capture an equal 45% for providing advanced services, while the remaining 10% flows into the governance treasury for ecosystem development.
This three-tier allocation creates a balanced incentive structure that addresses multiple network functions simultaneously. Miners compete to validate transactions and maintain blockchain security, earning their proportional share of block rewards. Masternodes, which require 1000 DASH collateral, deliver specialized infrastructure including InstantSend capabilities for near-instantaneous transactions confirmed within seconds, PrivateSend for transaction privacy, and deterministic voting mechanisms. The governance treasury, comprising 10% of all block rewards, empowers the community to democratically fund development initiatives and marketing efforts, creating a positive feedback loop where improved functionality attracts greater adoption and increases treasury funding.
This distribution model demonstrates how thoughtful token economic design can solve the governance challenges inherent in decentralized networks. By allocating rewards proportionally to contribution types—computational security, service provision, and strategic development—Dash ensures that different stakeholder classes remain aligned with long-term ecosystem health rather than competing for concentrated benefits.
Deflationary Economics: 18.9 Million Token Cap with Controlled 7.1% Annual Supply Reduction
DASH implements a deflationary economics framework designed to create predictable scarcity and support long-term value stability. The protocol operates with a fixed maximum supply cap of 18.9 million tokens, establishing a hard ceiling that distinguishes it from fiat currencies subject to unlimited expansion. Within this framework, the network employs a controlled 7.1% annual supply reduction mechanism that systematically decreases the rate at which new tokens enter circulation.
This annual supply reduction works through DASH's block reward structure, where newly created tokens decrease over time according to a predetermined schedule. Currently, approximately 12.55 million DASH tokens are in active circulation, representing roughly 66% of the maximum cap. The deflationary design means that each year, the percentage of new token creation diminishes, progressively slowing inflation until reaching the 18.9 million ceiling. This controlled approach to inflation management contrasts sharply with traditional monetary systems and many alternative cryptocurrencies that face unpredictable or unlimited supply growth.
The economic implications of this deflationary structure directly support DASH's token allocation model. By creating programmatic scarcity, the mechanism reinforces the value capture within the 45% masternode rewards, 45% miner compensation, and 10% governance allocation framework. Participants in each category benefit from an environment where supply pressure gradually eases, potentially supporting price stability and long-term incentive alignment. This integration of supply dynamics with the broader economic model demonstrates how deflationary mechanics can work synergistically with governance and infrastructure incentives to sustain a cryptocurrency ecosystem.
Governance Rights Tied to 1,000 DASH Masternode Collateral Creates Aligned Incentives
The 1,000 DASH masternode collateral requirement functions as both a financial commitment and a governance qualification mechanism, creating a powerful alignment between voting power and economic interests. Masternode operators who lock this collateral establish a meaningful bond with the DASH network, directly tying their governance rights to their financial stake. This design ensures that those making critical governance decisions through the Decentralized Governance by Blockchain (DGBB) system have substantial skin in the game.
Masternode operators earn approximately 7% annual block rewards for their participation, receiving roughly 1.5075 DASH per block alongside the 45% allocation designated for mining and the 10% reserved for governance proposals. This reward structure incentivizes long-term participation rather than short-term speculation. By requiring collateral that represents a significant investment, the system discourages malicious voting behavior—any governance decision that undermines network integrity directly threatens the operator's substantial collateral and future rewards.
The voting mechanism empowers these collateral-holding operators to approve or reject proposals that shape DASH's development and resource allocation. This creates a self-reinforcing cycle where governance participants benefit directly from decisions that strengthen the network. The economic alignment means masternode operators are inherently motivated to vote in ways that enhance network adoption, security, and long-term value appreciation, fundamentally linking their governance participation to genuine network stewardship rather than extractive behavior.
FAQ
Why does DASH adopt a three-layer allocation of 45% masternodes, 45% miners, and 10% governance in its token economic model?
DASH's allocation rewards miners 45% for computational work, masternodes 45% for enhanced services, and reserves 10% for governance budget to ensure continuous innovation and development.
How many DASH tokens are required to run a masternode, and what rewards can be earned?
Running a DASH masternode requires a minimum of 1,000 DASH tokens. Masternodes earn a portion of network block rewards, receiving approximately 45% of total block rewards alongside miners and governance funding.
How does DASH's governance system work? How is the 10% budget allocated and decided?
DASH allocates 10% of block rewards to a governance budget decided by community voting. Masternode holders vote on proposals for ecosystem development, marketing, and network improvements. Funds support the network's long-term growth and community initiatives through democratic decision-making processes.
Compared to Bitcoin's token distribution mechanism, what are the advantages of DASH's three-tier model?
DASH's three-tier model incentivizes network security through miners, infrastructure through masternodes providing privacy and faster transactions, and community governance through treasury allocation. This balanced approach enhances decentralization and functionality compared to Bitcoin's single-layer mining structure.
How does DASH balance interest conflicts between masternodes, miners, and governance participants?
DASH balances interests through a 45-45-10 reward split, distributing incentives across all stakeholders. Masternodes and miners earn consistent rewards, while governance participants gain voting power over network decisions. This decentralized structure reduces conflicts and ensures collaborative consensus development.
How does DASH's token economic model impact its long-term sustainability and ecosystem development?
DASH's 45-45-10 allocation model ensures sustainable growth by funding masternodes for network security, miners for transaction processing, and governance for development. This balanced distribution strengthens ecosystem resilience and long-term viability through diversified incentives.

How Does the Token Economic Model Balance Value Distribution in Crypto Projects?

How Does Kaspa's Token Economic Model Differ from Traditional Cryptocurrencies?

# What Is Token Economics Model: KAS Distribution, Tokenomics & Supply Mechanics Explained

What Is Pi Network's Real Value in 2025: A Fundamental Analysis

Understanding Block DAG Technology in Crypto

What Is the Future of Pi Network: A Fundamental Analysis of PI Coin in 2025?

What is Banana For Scale (BANANAS31) market cap and trading volume today?
How to use MACD, RSI, and Bollinger Bands to predict WOO token price movements in 2026
What are the key differences between leading cryptocurrency exchanges: comparing market share, performance, and user base in 2026

How Does Arweave (AR) Price Volatility Compare to Bitcoin and Ethereum in 2026?

What Are Compliance and Regulatory Risks in Cryptocurrency Markets: How SEC Oversight and KYC/AML Policies Impact Token Projects