Analysis of the current fear and greed levels in the cryptocurrency market


Crypto Fear and Greed Index: Definition, Mechanisms, and Online Tracking
The Crypto Fear and Greed Index is a critical tool for traders and investors, enabling them to gauge market sentiment and make data-driven decisions. This indicator quantifies the market’s emotional landscape, highlighting optimal entry and exit points.
What Is the Fear and Greed Index?
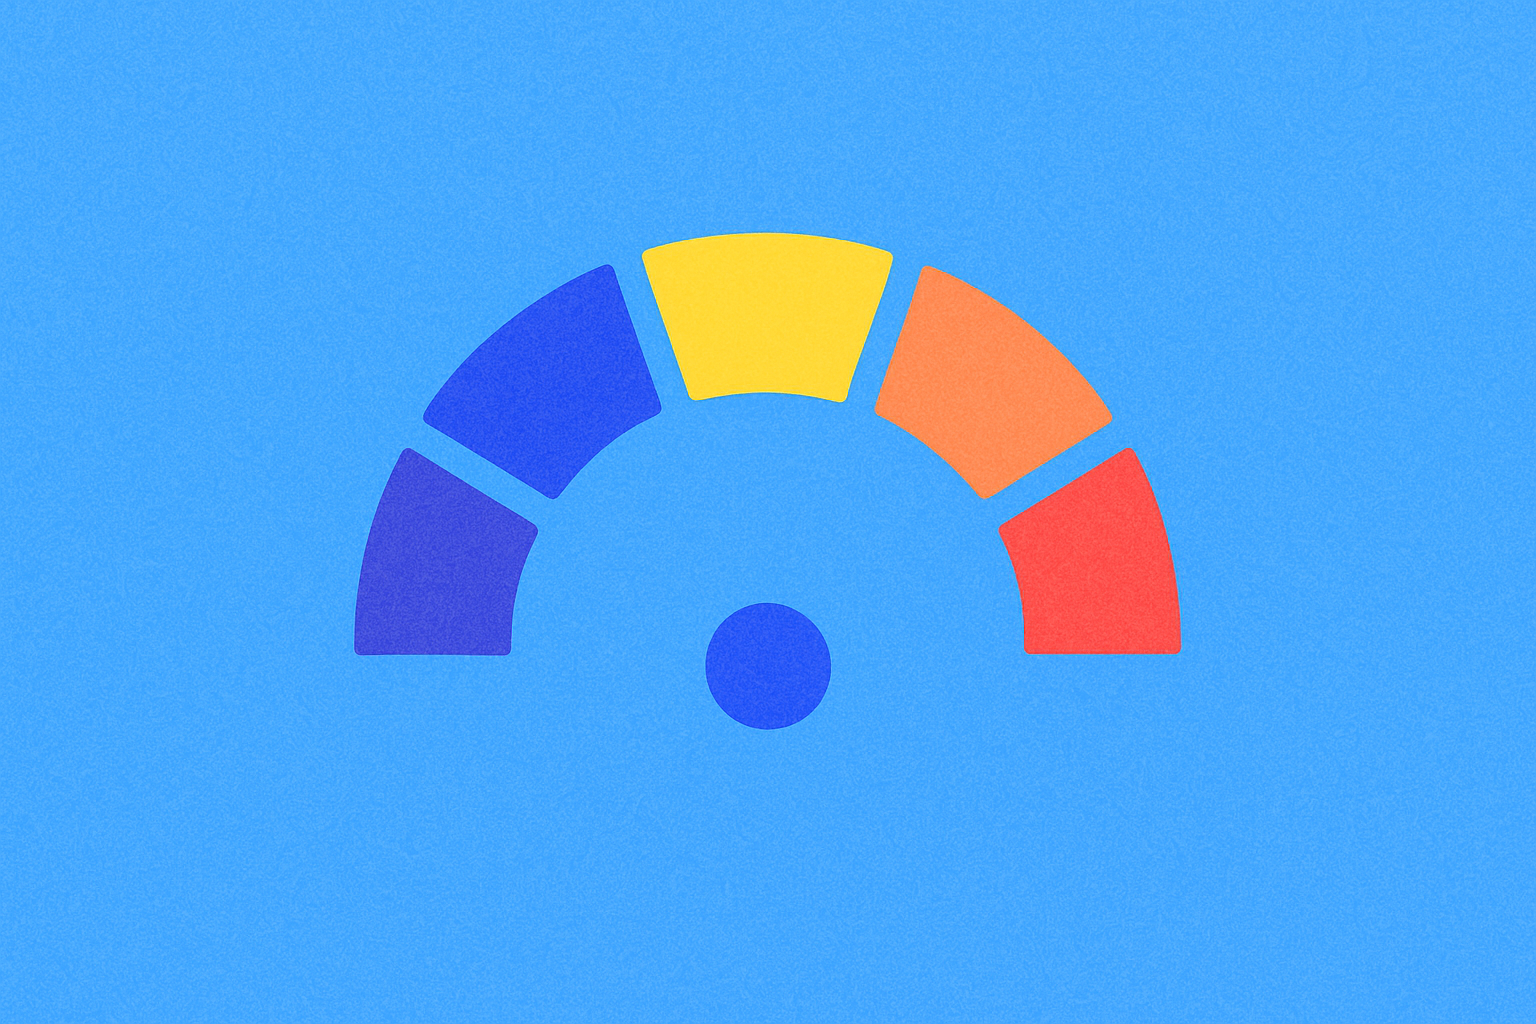
The Fear and Greed Index is a numerical metric that represents the emotional state of cryptocurrency market participants. Its scale ranges from 0 to 100, with 0 indicating extreme fear marked by panic selling and potential undervaluation, and 100 denoting extreme greed, signaling an overheated market and a likely correction.
Originally adapted from the traditional stock market, the index in crypto primarily centers on Bitcoin (BTC), whose price movements often influence the broader market. The indicator helps traders monitor market psychology and identify pivotal price chart turning points.
Decoding the Index: Fear vs. Greed
During periods of fear, investors anticipate further declines, triggering widespread sell-offs, reduced demand, and undervalued assets. Such fear may indicate oversold conditions, which savvy traders view as an opportunity to acquire assets at discounted prices.
Greed emerges when the market rallies and traders aggressively buy, expecting continued price gains. This environment can drive asset overvaluation and signals impending corrections or consolidations. In greedy periods, traders often expand positions and use leverage, increasing loss risk if the market reverses.
Why the Fear and Greed Index Matters
The Fear and Greed Index is essential for identifying market trends—low readings (fear) suggest entry opportunities, while high readings (greed) point to potential exits. The index helps traders avoid impulsive decisions, which often result in losses. By leveraging the index, traders can deploy contrarian strategies—buying amid panic and selling during exuberance.
How the Crypto Fear and Greed Index Works
The Fear and Greed Index relies on a comprehensive analysis of several key market metrics. Volatility accounts for 25% of the total index and is measured by current Bitcoin volatility and maximum drawdowns. Elevated volatility typically signals fear and market uncertainty.
Trading volume makes up another 25% of the index and reflects current market activity. Increased volume indicates heightened buying and elevated greed. Social media sentiment (15%) is assessed by tracking mentions of Bitcoin and other cryptocurrencies; high activity signals greed and strong investor interest.
Market surveys (15%) are used by some platforms to gauge trader sentiment directly. Bitcoin dominance (10%) serves as a proxy for investor preferences—an increase signals fear of altcoins, while a decrease reflects greed and appetite for alternatives. Google Trends (10%) provides insight into public interest via Bitcoin-related search queries.
Data Sources for the Fear and Greed Index
The index aggregates data from leading sources. Market statistics on prices, volume, and volatility are drawn from major crypto exchanges. Social media analysis leverages posts on X, Reddit, and Telegram, where crypto discussions are active. Search engines, particularly Google Trends, offer data on search frequency and popularity. Some platforms use surveys and polls to capture trader sentiment directly.
The Fear and Greed Index is typically updated daily, though some platforms refresh data every 12 hours. This frequent updating allows traders to monitor sentiment shifts in real time and act swiftly on emerging signals.
Where to Track the Fear and Greed Index Online
Several reputable sources provide live tracking of the Fear and Greed Index. Alternative.me is among the most popular platforms, offering daily Bitcoin index updates, current scores, historical data, and detailed trend charts for long-term analysis.
CoinMarketCap features its own Fear and Greed Index with API access for seamless integration into trading tools. Data is refreshed daily and covers multiple cryptocurrencies. CoinStats updates every 12 hours and provides charts for BTC and other coins, which is particularly valuable for short-term traders.
Tracking on TradingView
TradingView doesn’t offer a native Fear and Greed Index, but traders can use custom Pine Script integrations to import index data via API. Alternatively, users analyze correlated indicators—such as volatility or volume—that mirror market sentiment captured by the index. Following news feeds and community sentiment provides an indirect read on market emotions.
Mobile Apps and Index Integration
Mobile-focused traders benefit from specialized apps and widgets. CoinStats delivers iOS and Android apps with home screen widgets for the Fear and Greed Index. Blockfolio presents market sentiment data and lets users integrate index statistics into their portfolio. Numerous sites provide HTML widgets for embedding the index into personal websites and trading platforms.
Crypto Fear and Greed Index: Latest Trends
Recently, the Crypto Fear and Greed Index has evolved rapidly, gaining widespread adoption among traders and analysts. Its values fluctuate continuously with market conditions and major crypto events. Traders should routinely monitor the index to pinpoint optimal entry and exit moments.
Index Dynamics Across Asset Classes
The index for altcoins is less standardized than for Bitcoin, but altcoin sentiment often tracks BTC price movements. Rising BTC dominance can prompt fear and price declines in altcoins due to capital outflows, while falling BTC dominance often signals greed and stronger altcoin rallies.
Comparison to Traditional Market Indices
The Crypto Fear and Greed Index shares a similar framework with stock market counterparts but differs in key areas. Crypto markets are far more volatile, making the index more dynamic and sensitive to sharp swings. Its unique data sources, including social media and Google Trends, set it apart from traditional financial indices.
How to Use the Fear and Greed Index in Trading
Buy Strategy During Extreme Fear
This strategy is most effective when the index registers extreme fear (0–24) or fear (25–49), signaling an oversold market and undervalued assets. An index below 24 marks panic conditions—often historic buying opportunities.
Implementation example: Check the Fear and Greed Index. If below 24, proceed with analysis. Use the BTC/USDT chart on a 1-hour or 4-hour timeframe, along with RSI and MACD indicators. If RSI falls below 30 (oversold) and MACD signals a reversal, enter a long position via limit order at support. Set a stop-loss 1–2% below entry for risk control. Target take-profit at the nearest resistance or when the index recovers to 50, indicating the end of panic.
Sell Strategy During Extreme Greed
Deploy this strategy when the index signals greed (51–74) or extreme greed (75–100)—conditions that point to overbought assets and an imminent correction. Readings above 75 indicate an overheated market primed for reversal.
Monitor the index continuously. When it exceeds 75, review the ETH/USDT or other asset charts and review key indicators: RSI above 70 (overbought) and Bollinger Bands pressing against the upper band. Initiate a short position with prudent leverage, placing a stop-loss 1–2% above entry. Set take-profit at support or when the index declines to 50, reflecting normalized sentiment.
Contrarian Index Strategy
The contrarian approach counters the crowd—buy when the market is fearful (index 10–20) and sell when it’s greedy (index 80–90). Use the Fear and Greed Index to spot extremes and always corroborate signals with technical analysis.
At an index value of 10 (extreme fear), seek spot market entries for long-term positions. At 90 (extreme greed), secure profits as corrections are likely. Note that extreme index readings typically mark major price reversals.
Combining the Index with Technical Indicators
Boost effectiveness by pairing the Fear and Greed Index with other tools. RSI confirms oversold (below 30) or overbought (above 70) conditions. MACD indicates trend reversals and supports directional changes. Volume reflects move strength: rising volume with price surges signals greed, while rising volume during declines points to fear.
Always track news for fundamental drivers. Regulatory events, protocol upgrades, and macroeconomic developments may shift markets regardless of the index’s reading.
Practical Tips for Using the Fear and Greed Index
Avoid relying exclusively on the Fear and Greed Index. It’s valuable and informative but should be used alongside technical and fundamental analysis. Treat the index as one tool among many, not as a singular trading signal.
Test your strategies on demo accounts before risking capital. This builds proficiency, deepens your understanding of index behavior, and enables parameter optimization without financial exposure. Analyze historical data to see how the index has correlated with BTC prices—look for patterns and repeatable scenarios.
Effective risk management is vital for sustained success. Use stop-losses for every position and avoid excessive leverage. Monitor social media and sentiment to validate index readings, since real trader emotions directly shape market moves.
Conclusion
The Crypto Fear and Greed Index is a robust tool for reading market sentiment and making informed trades. It empowers traders to spot extreme emotions and capitalize on pivotal buy and sell opportunities. Its impact is greatest when combined with technical analysis and disciplined risk controls.
For trading success, track the index on trusted sites like Alternative.me or CoinMarketCap, integrate its readings with technical indicators, and manage risk with stop-losses. Remember: the index’s extreme values often align with major market reversals, presenting seasoned traders with significant profit opportunities.
FAQ
What Does the Fear and Greed Index Indicate?
The Fear and Greed Index quantifies crypto market sentiment from 0 (fear) to 100 (greed) by analyzing volatility, trading volume, social sentiment, and Bitcoin dominance—helping assess market cycles and spot key reversal points.
How Should You Interpret the Fear and Greed Index?
The index captures market emotion from 0 to 100. 0–25 signals extreme fear (prime buying opportunities), 25–45 fear, 45–55 neutral, 55–75 greed, and 75–100 extreme greed (potential overbought). Use it to analyze cycles and guide strategic choices.
What Is the Fear and Greed Index in Crypto?
The Fear and Greed Index measures the emotional state of the crypto market. It analyzes volatility, trading volume, social sentiment, and trends to determine whether the market is driven by fear or greed. Values from 0 to 100 help traders diagnose sentiment and make informed calls.
What Is the Fear and Greed Index?
The index assesses crypto market sentiment from 0 (fear) to 100 (greed) by analyzing volatility, price action, trading volume, and investor interest—helping traders evaluate current conditions and make sound decisions.
How Is the Fear and Greed Index Calculated?
The index is computed by analyzing price volatility, trading volume, social sentiment, and overall crypto market dynamics. Its algorithm factors in price swings, trading activity, and investor mood, producing a score from 0 (fear) to 100 (greed) that reflects prevailing market psychology.
What Are Optimal Index Values for Buying?
Prime buying conditions are 0–25 (extreme fear) and 25–45 (fear). At these levels, assets are often undervalued, presenting attractive entry points. Readings above 75 signal excessive greed and potential price corrections.
How Do You Use the Fear and Greed Index for Crypto Trading?
The index helps pinpoint market cycles. Low readings (fear) suggest buying, while high readings (greed) suggest selling. Always use the index in conjunction with technical analysis for best trading results.

How Does Crypto Holdings and Fund Flow Analysis Reveal Market Trends?
Cryptocurrency Fear and Greed Index
How Do Technical Indicators Signal Crypto Market Trends in 2025?

How Do MACD, RSI, and Bollinger Bands Predict Crypto Market Trends?

Understanding Crypto Market Manipulation: The Pump and Dump Tactics
AI-Driven Crypto Trading Bot Solutions

1 Pi Coin Value in Indian Rupees: Market Analysis and Future Outlook
Where are Bitcoin Servers?
How Long Does It Take CashApp to Verify
How to Transfer Bitcoin to Another Wallet: A Comprehensive Step-by-Step Guide

Is the Stock Market Open on July 3rd: Trading Hours Guide