Bearish Market Signal: Key Indicators You Need to Watch Now


Understanding the Bearish Market Signal: What It Means for Cryptocurrency Investors
The term "Bearish Market Signal" has become a critical focus for cryptocurrency investors, especially as market conditions shift in response to on-chain metrics, historical patterns, and macroeconomic factors. October, often a crucial month for market transitions, has brought renewed attention to bearish indicators that suggest potential downward pressure on digital asset prices.
A bearish market signal represents a collection of technical, fundamental, and sentiment-based indicators that collectively suggest declining prices and negative market momentum. For cryptocurrency investors, understanding these signals is essential for risk management and strategic positioning. These signals emerge from various data sources including blockchain analytics, trading volume patterns, investor behavior metrics, and broader economic conditions that influence capital flows into and out of the crypto market.
The significance of recognizing bearish signals lies in their potential to help investors protect capital, adjust portfolio allocations, and identify optimal entry points for future positions. While no single indicator provides absolute certainty, the convergence of multiple bearish signals often precedes significant market corrections or extended downtrends.
Key On-Chain Indicators That Signal a Bearish Market
The Bull/Bear Market Indicator
The Bull/Bear Market Indicator, a composite metric that evaluates overall market health, has declined to zero—a level not observed since the bear market of 2022. This indicator synthesizes multiple data points including network activity, transaction volumes, and holder profitability to generate a comprehensive market health score.
When this indicator reaches zero, it suggests that the balance of on-chain evidence has shifted decisively toward bearish conditions. Historical analysis shows that previous instances of this indicator reaching zero have coincided with extended periods of price decline and market consolidation. The indicator's methodology weighs factors such as active addresses, transaction values, and the ratio of profitable to unprofitable holders, providing a multi-dimensional view of market sentiment.
The current reading indicates that network fundamentals have weakened substantially, with decreased transaction activity and declining profitability among market participants. This suggests that the underlying demand for cryptocurrency has softened, potentially setting the stage for continued price pressure.
365-Day Moving Average (MA)
The 365-day Moving Average (MA) serves as a critical support level for Bitcoin and other major cryptocurrencies. Historically, when Bitcoin's price falls below this level, it frequently signals the beginning of a bearish market phase that can persist for months or even years.
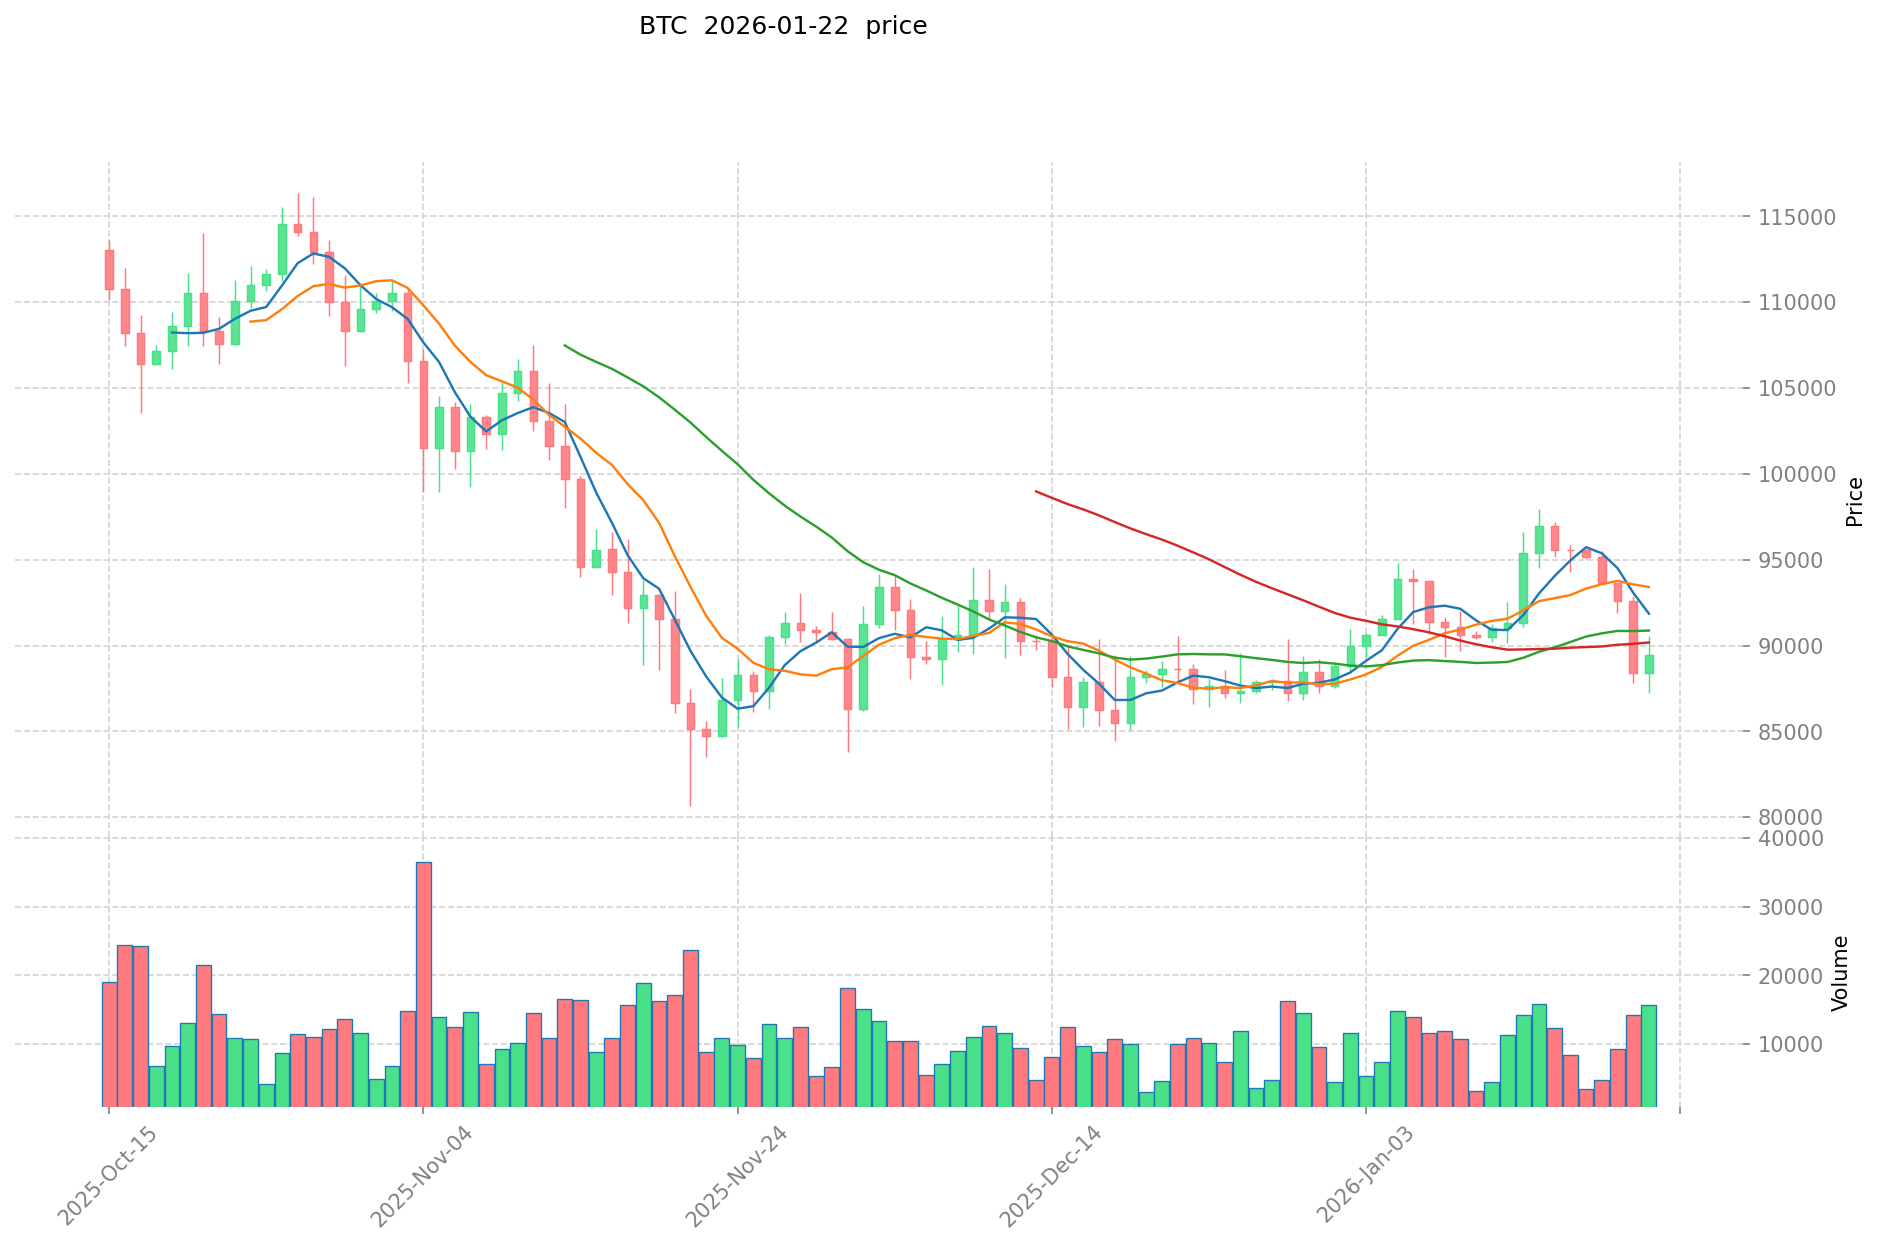
This long-term moving average acts as a psychological and technical threshold that separates bullish from bearish market structures. During bull markets, prices typically remain above the 365-day MA, with the average serving as dynamic support during corrections. Conversely, when prices break below this level and fail to reclaim it quickly, it often indicates a fundamental shift in market dynamics.
The 365-day MA reflects the average acquisition price of Bitcoin holders over the past year, making it a meaningful reference point for assessing whether the market is in profit or loss territory. A sustained break below this level suggests that the majority of recent buyers are underwater on their positions, which can trigger additional selling pressure as investors seek to minimize losses or exit positions.
Relative Strength Index (RSI)
The Relative Strength Index (RSI), a widely utilized momentum oscillator, has entered oversold territory in recent periods. The RSI measures the speed and magnitude of price changes, generating values between 0 and 100, with readings below 30 typically indicating oversold conditions.
While oversold RSI readings can sometimes signal potential buying opportunities, in the context of a developing bear market, they may simply indicate the beginning of a prolonged downtrend rather than an imminent reversal. The RSI's utility lies in identifying extreme conditions, but it must be interpreted alongside other indicators to avoid false signals.
In bearish markets, the RSI can remain in oversold territory for extended periods as selling pressure persists. The current oversold reading suggests that downward momentum has been strong, but without confirming signals from other indicators, it does not necessarily indicate an immediate bottom. Investors should watch for RSI divergences—situations where price makes new lows but RSI does not—as these can provide early warnings of potential trend reversals.
Market Value to Realized Value (MVRV) Ratio
The MVRV ratio, which compares market capitalization to realized capitalization, has turned negative in recent periods. This indicates that the majority of investors are holding Bitcoin at a loss relative to their acquisition prices, a classic bearish signal that often precedes extended market corrections.
Realized capitalization represents the aggregate value of all coins at their last transaction price, providing a more accurate measure of the actual capital invested in the network compared to simple market capitalization. When the MVRV ratio falls below 1.0 (or becomes negative when expressed differently), it suggests that the current market price is below the average acquisition price of all holders.
Historically, negative MVRV ratios have coincided with market bottoms, as they indicate maximum pain for investors and often precede capitulation events. However, the ratio can remain negative for extended periods during severe bear markets, and its predictive power is enhanced when combined with other metrics. The current negative reading suggests widespread unrealized losses across the holder base, which can lead to increased selling pressure as investors seek to exit positions or reduce exposure.
Historical Patterns and Market Cycles
The Four-Year Market Cycle
Bitcoin's price movements frequently follow a four-year cycle, strongly influenced by halving events and evolving market sentiment. This cyclical pattern has been one of the most reliable frameworks for understanding cryptocurrency market dynamics since Bitcoin's inception.
The four-year cycle typically consists of several distinct phases: accumulation following a major bottom, a markup phase characterized by rising prices and increasing participation, a distribution phase where early investors take profits, and finally a markdown phase featuring declining prices and reduced market interest. Halving events, which reduce Bitcoin's inflation rate by cutting miner rewards in half, occur approximately every four years and have historically served as catalysts for new bull market cycles.
Understanding where the market sits within this four-year cycle provides valuable context for interpreting current bearish signals. If the market is in the latter stages of a cycle, bearish indicators may suggest an impending transition to a new accumulation phase. However, if the cycle is still in its early stages, bearish signals might indicate temporary corrections rather than major trend reversals.
Wyckoff Distribution Pattern
The Wyckoff distribution pattern, a technical analysis framework developed by Richard Wyckoff, suggests that Bitcoin may be entering a prolonged correction phase. This pattern describes how large holders (often called "smart money") distribute their holdings to retail investors at market tops before prices decline significantly.
The Wyckoff distribution consists of several phases: preliminary supply (initial selling by informed investors), buying climax (final surge in buying that marks the top), automatic reaction (initial decline), secondary test (retest of the high), sign of weakness (breakdown below support), and markdown (sustained decline). Identifying these phases in real-time is challenging, but the framework provides a useful lens for understanding market structure.
The current market structure exhibits several characteristics consistent with Wyckoff distribution, including weakening momentum on rallies, declining volume, and failure to establish new highs. If this pattern continues to develop, it could indicate that major holders are systematically reducing positions, which would support a bearish outlook for the coming months.
W-Shaped Recovery vs. V-Shaped Reversal
Unlike the rapid V-shaped recoveries observed in previous bull markets, the current market is showing signs of a W-shaped recovery pattern. This distinction is significant because it suggests a more uncertain and volatile path forward rather than a quick return to bullish conditions.
V-shaped recoveries occur when markets experience sharp declines followed by equally rapid rebounds, typically driven by strong fundamental catalysts or oversold conditions that attract aggressive buying. These patterns are characteristic of healthy bull markets where dips are quickly absorbed by strong demand.
In contrast, W-shaped recoveries involve an initial decline, a partial recovery, a retest of lows (or new lows), and then a gradual recovery. This pattern indicates uncertainty and lack of conviction among market participants, with neither bulls nor bears able to establish clear control. The current market structure suggests that even if prices recover from recent lows, they may face additional tests before establishing a sustainable uptrend. This pattern often emerges during transitions from bull to bear markets or during extended consolidation periods.
Investor Behavior: Long-Term Holders vs. Short-Term Holders
Long-Term Holders Selling
Long-term Bitcoin holders have begun selling significant portions of their holdings in recent periods, a behavior that often precedes or accompanies major market corrections. Long-term holders are typically defined as entities that have held Bitcoin for more than 155 days, and their selling activity is closely monitored as an indicator of market sentiment.
These holders are generally considered more informed and less prone to emotional decision-making compared to short-term traders. When long-term holders begin distributing their positions, it often signals that they perceive current prices as attractive exit points or that they anticipate declining prices ahead. This behavior can create a self-fulfilling prophecy, as increased supply from long-term holders puts downward pressure on prices.
On-chain data tracking the movement of coins from long-term holder addresses to exchanges provides real-time insights into this distribution process. The current trend shows accelerating outflows from long-term holder addresses, suggesting that these sophisticated market participants are reducing exposure. This behavior, combined with other bearish indicators, reinforces the case for cautious positioning and risk management.
Short-Term Holders Facing Losses
Short-term holders are experiencing unrealized losses in the current market environment, which can lead to panic selling and accelerated price declines. Short-term holders, defined as entities holding Bitcoin for less than 155 days, tend to be more sensitive to price fluctuations and more likely to sell during periods of stress.
When short-term holders are underwater on their positions, it creates a cohort of investors with strong incentives to exit at any opportunity to minimize losses. This dynamic can lead to cascading sell-offs during periods of market weakness, as each wave of selling triggers additional selling from other short-term holders seeking to avoid further losses.
The profitability of short-term holders serves as a useful sentiment indicator. When this group is predominantly in profit, it suggests strong market momentum and the potential for continued price appreciation. Conversely, when short-term holders are largely in loss territory, it indicates weak market structure and vulnerability to further declines. The current situation, with widespread losses among short-term holders, suggests that the market lacks the strong hands needed to support higher prices.
Tether Dominance and Its Implications
Tether dominance, which measures Tether's (USDT) market share within the cryptocurrency ecosystem, has risen to its highest level since April. This metric provides insights into investor risk appetite and capital flows within the crypto market.
Tether and other stablecoins serve as safe havens within the cryptocurrency ecosystem, allowing investors to exit volatile assets without converting to fiat currency. When Tether dominance rises, it indicates that investors are moving capital out of Bitcoin, altcoins, and other risk assets into the relative safety of stablecoins. This behavior typically reflects declining risk appetite and bearish market sentiment.
The current elevated level of Tether dominance suggests that a significant amount of capital is sitting on the sidelines in stablecoin form, waiting for more attractive entry points or clearer market direction. While this capital could potentially flow back into risk assets and drive prices higher, the fact that it remains in stablecoins indicates that investors are not yet confident in the market's ability to sustain higher prices.
Historically, periods of high stablecoin dominance have coincided with market bottoms, as they represent maximum risk aversion. However, they can also persist during extended bear markets as investors remain cautious. Monitoring changes in Tether dominance can provide early signals of shifting sentiment—declining dominance would suggest capital flowing back into risk assets, while rising dominance would indicate continued caution.
Trends in the Bitcoin Options Market
The Bitcoin options market is dominated by put options in recent periods, which allow traders to sell Bitcoin at predetermined prices. This skew toward put options reflects bearish sentiment and hedging activity among sophisticated market participants.
Options markets provide valuable insights into investor expectations and risk positioning. Put options increase in value when prices decline, making them useful tools for hedging long positions or speculating on downward price movements. When put option volume and open interest significantly exceed call options (which profit from price increases), it indicates that traders are either protecting against downside risk or actively positioning for lower prices.
The put-call ratio, which compares put option volume to call option volume, has risen substantially in recent periods. High put-call ratios typically indicate bearish sentiment, though extremely high readings can sometimes signal excessive pessimism that precedes market bottoms. The current elevated ratio suggests that options traders are positioning defensively, anticipating continued volatility and potential downside.
Additionally, the implied volatility of options—which reflects the market's expectation of future price fluctuations—has increased, indicating that traders are pricing in greater uncertainty. This elevated volatility premium makes options more expensive and reflects the market's assessment of increased risk in the current environment.
Macroeconomic Factors Influencing the Market
Federal Reserve Policies
Federal Reserve monetary policies, particularly interest rate decisions, significantly influence cryptocurrency market sentiment and capital flows. The relationship between traditional financial markets and cryptocurrency markets has strengthened over the past several years, making macro factors increasingly important for crypto investors.
When the Federal Reserve raises interest rates to combat inflation, it increases the cost of capital and makes risk-free assets like Treasury bonds more attractive relative to speculative assets like cryptocurrencies. Higher rates also tend to strengthen the US dollar, which can put downward pressure on dollar-denominated assets including Bitcoin. Conversely, when the Fed cuts rates or maintains accommodative policies, it tends to support risk assets by lowering the opportunity cost of holding non-yielding assets.
The current monetary policy environment, characterized by elevated interest rates and quantitative tightening, has created headwinds for cryptocurrency markets. While the Fed has signaled potential rate cuts in the future, the timing and magnitude of such cuts remain uncertain. Until monetary conditions ease substantially, cryptocurrencies may continue to face pressure from macro factors.
ETF Approvals
While Bitcoin ETF approvals have historically served as bullish catalysts, the current slowdown in institutional flows suggests that this factor alone may not be sufficient to reverse bearish trends. The approval of spot Bitcoin ETFs in early 2024 was widely anticipated to drive sustained institutional adoption and price appreciation.
Initially, ETF launches generated significant inflows as institutions and retail investors gained easier access to Bitcoin exposure through traditional brokerage accounts. However, these flows have moderated in recent periods, indicating that the initial wave of enthusiasm has subsided. Some ETFs have even experienced net outflows, suggesting that the institutional appetite for Bitcoin exposure may be more limited than initially expected.
The ETF narrative remains important for long-term adoption, as these vehicles provide regulatory clarity and accessibility that can attract conservative institutional investors. However, in the near term, the slowdown in ETF flows removes a key source of buying pressure that had previously supported prices. For ETFs to serve as a bullish catalyst again, we would need to see renewed inflows driven by either improving market conditions or new institutional mandates to allocate to digital assets.
Geopolitical Events
Geopolitical tensions and regulatory changes continue to shape cryptocurrency market dynamics in complex ways. Cryptocurrencies have sometimes been characterized as safe-haven assets similar to gold, but their behavior during geopolitical crises has been inconsistent, sometimes acting more like risk assets that decline during periods of uncertainty.
Regulatory developments across major jurisdictions can have immediate and significant impacts on cryptocurrency markets. Positive regulatory clarity, such as the establishment of clear frameworks for digital asset custody and trading, can support prices by reducing uncertainty and enabling institutional participation. Conversely, regulatory crackdowns or unfavorable policy decisions can trigger sharp selloffs.
Ongoing geopolitical tensions, including conflicts, trade disputes, and shifts in international monetary systems, create an unpredictable backdrop for all financial markets. While some investors view Bitcoin as a hedge against geopolitical risk and currency debasement, others treat it as a speculative asset that should be reduced during periods of uncertainty. The net effect of geopolitical factors on cryptocurrency prices depends on which narrative dominates market sentiment at any given time.
Technical Analysis Tools for Navigating Bear Markets
Moving Averages
Moving averages, such as the 365-day MA, are essential tools for identifying key support and resistance levels during bearish market conditions. These indicators smooth out price data to reveal underlying trends and provide objective reference points for decision-making.
Beyond the 365-day MA, other commonly watched moving averages include the 50-day, 100-day, and 200-day MAs. Each of these averages serves different purposes: shorter-term averages are more responsive to recent price changes and useful for identifying near-term trends, while longer-term averages provide perspective on major trend direction. The relationship between different moving averages—such as whether shorter-term averages are above or below longer-term averages—provides additional insights into market structure.
In bear markets, moving averages often act as resistance levels that cap rallies, whereas in bull markets they serve as support during corrections. The current positioning of price relative to key moving averages suggests a bearish market structure, with prices struggling to reclaim important averages on rebounds. Monitoring how prices interact with these levels can help investors identify potential turning points or confirm trend continuation.
MVRV Ratio
The MVRV ratio offers valuable insights into market valuation and investor profitability, making it an indispensable tool for bear market navigation. By comparing the market's current valuation to the aggregate cost basis of all holders, this metric helps identify periods of extreme overvaluation or undervaluation.
Historically, MVRV ratios above 3.0 have coincided with market tops, as they indicate that the average holder is sitting on substantial profits and may be inclined to take profits. Conversely, MVRV ratios below 1.0 have often marked market bottoms, as they reflect widespread losses and capitulation. The current negative MVRV reading suggests that the market may be approaching or already in value territory, though timing exact bottoms remains challenging.
Investors can use the MVRV ratio to inform position sizing and entry timing. When the ratio is negative or very low, it suggests favorable risk-reward dynamics for accumulation, even if prices may decline further in the short term. When the ratio is elevated, it suggests caution and potentially reducing exposure. This metric is particularly useful because it incorporates on-chain data about actual holder cost basis rather than relying solely on price action.
Bull Score
The Bull Score, a composite metric that assesses overall market health, has fallen to zero in recent periods. This indicator synthesizes multiple data points including network activity, holder profitability, momentum indicators, and market structure to generate a single health score ranging from 0 to 100.
A Bull Score of zero indicates that the preponderance of evidence suggests bearish conditions, with most underlying metrics showing weakness. This comprehensive approach helps filter out noise from individual indicators and provides a clear signal about overall market direction. While no single metric is perfect, the Bull Score's multi-factor approach reduces the risk of false signals from any single data point.
The current zero reading confirms what other indicators are suggesting: that the market has entered a bearish phase characterized by weak fundamentals, negative sentiment, and technical deterioration. For investors, this suggests that caution is warranted and that opportunities for aggressive positioning are limited until the Bull Score begins to recover.
Preparing for a Bearish Market Environment
The "Bearish Market Signal" is flashing across multiple indicators, from on-chain metrics like the 365-day MA and MVRV ratio to macroeconomic factors and investor behavior patterns. This convergence of bearish signals suggests that the cryptocurrency market may face continued challenges in the near to medium term.
For investors, recognizing these signals is the first step toward effective risk management. Bearish markets require different strategies than bull markets—focusing on capital preservation, selective accumulation at favorable valuations, and maintaining discipline rather than chasing momentum. By staying informed about on-chain indicators, utilizing technical analysis tools, and monitoring macro factors, investors can better navigate challenging market conditions.
Key strategies for bear market navigation include: reducing overall portfolio exposure to match risk tolerance, focusing on quality assets with strong fundamentals, using dollar-cost averaging to accumulate positions gradually, setting clear stop-loss levels to limit downside, and maintaining adequate liquidity to take advantage of opportunities when they arise. Additionally, investors should avoid emotional decision-making, resist the temptation to catch falling knives, and maintain a long-term perspective that acknowledges market cycles.
While bearish markets are uncomfortable, they also create opportunities for patient investors who can identify value and accumulate positions when sentiment is most negative. By understanding the indicators discussed in this analysis and maintaining disciplined risk management, investors can position themselves for long-term success even as they navigate near-term challenges. The key is to remain adaptable, continuously reassess market conditions, and adjust strategies as new information becomes available.
FAQ
What are bearish market signals? How to judge if the market is entering a bear market stage?
Bearish signals include: declining prices breaking key support levels, decreasing trading volume, negative funding rates, and weakening momentum indicators. When prices fall below major resistance lines, social sentiment turns negative, and transaction volume drops significantly, the market typically enters bear phase. Technical analysis combined with on-chain metrics helps confirm trend reversal.
What are the key technical indicators that can provide early warning of a bear market, such as MACD, RSI, and moving averages?
Key bearish indicators include MACD crossovers below signal lines, RSI below 30 signaling oversold conditions, price falling below 200-day moving averages, declining trading volume, and divergences between price and momentum. These suggest potential downtrends ahead.
What investment strategies should be adopted to protect assets when a bear market arrives?
During bear markets, consider diversifying your portfolio across multiple assets, increasing stablecoin holdings for dry powder, dollar-cost averaging into quality projects, utilizing stop-loss orders, and maintaining a long-term perspective. Focus on projects with strong fundamentals and community support rather than speculation.
What are some famous historical bear market signal cases and how did the market react?
The 2008 financial crisis showed inverted yield curves and credit spreads widening, triggering a 50% market decline. In 2018, the crypto winter featured sustained volume decline and technical breakdowns, causing 80% corrections. The 2022 event displayed rising inflation signals and Fed rate hikes, resulting in major liquidations and 65% drops across assets.
How to distinguish between short-term adjustments and true bearish market trends?
Monitor trading volume, moving averages, and support levels. Short-term corrections show high volatility with bounces; true bearish trends display declining volume, break below key support, and sustained downward momentum across multiple timeframes. Analyze market sentiment indicators for confirmation.
Should investors immediately liquidate all positions after bearish market signals appear?
No. Bearish signals warrant reassessment, not panic selling. Consider your investment timeline, portfolio allocation, and risk tolerance. Strategic rebalancing or selective position reduction may be prudent, but liquidating everything locks in losses and risks missing recovery bounces. Professional investors often view downturns as opportunities.

How Does the Federal Reserve's Monetary Policy Affect Bitcoin Price Volatility in 2025?

How Does Federal Reserve Policy Affect Bitcoin and Cryptocurrency Prices in 2026?

How does Federal Reserve monetary policy affect cryptocurrency prices in 2026

How Does Macroeconomic Correlation Affect Cryptocurrency Value in 2025?

How Do Federal Reserve Policy and Inflation Data Impact Cryptocurrency Prices in 2025?
Shock to Crypto's Resilience: Why Bitcoin Crashed 10% as Macro Risk Roiled Markets

What do crypto derivatives market signals reveal about futures, funding rates, and liquidations?

How do cryptocurrency competitors compare by performance, market cap, and user adoption in 2026

What is the Current Crypto Market Overview: Top Market Cap, Trading Volume, and Liquidity Rankings in 2026

Does a Crypto Mining Bot Exist on Telegram?

What factors drive cryptocurrency price volatility and how do support resistance levels impact trading decisions