Bitcoin Fear and Greed Index: What Does Current Market Sentiment Reveal?
What Does the Bitcoin Fear and Greed Index Measure?
Index Purpose
All financial markets run on two core forces: objective data and the subjective emotions of investors. Technical indicators help track price trends, but sentiment ultimately drives major rallies and sharp declines. Investors react strongly to news, price swings, and viral stories on social media platforms.
The Bitcoin Fear and Greed Index was created to distill these complex emotions into a single, easy-to-read number. Its main goal is to give traders a fast way to gauge overall market mood and spot when the crowd is excessively anxious or overly confident.
Fear tends to spike after steep drops, when negative headlines circulate and investors worry about what’s next. Greed takes over in hot bull runs, as people pile in hoping for fast gains. Measuring the push and pull between these emotions helps investors understand the psychological backdrop of each Bitcoin move—and make smarter investment choices.
How the Index Works
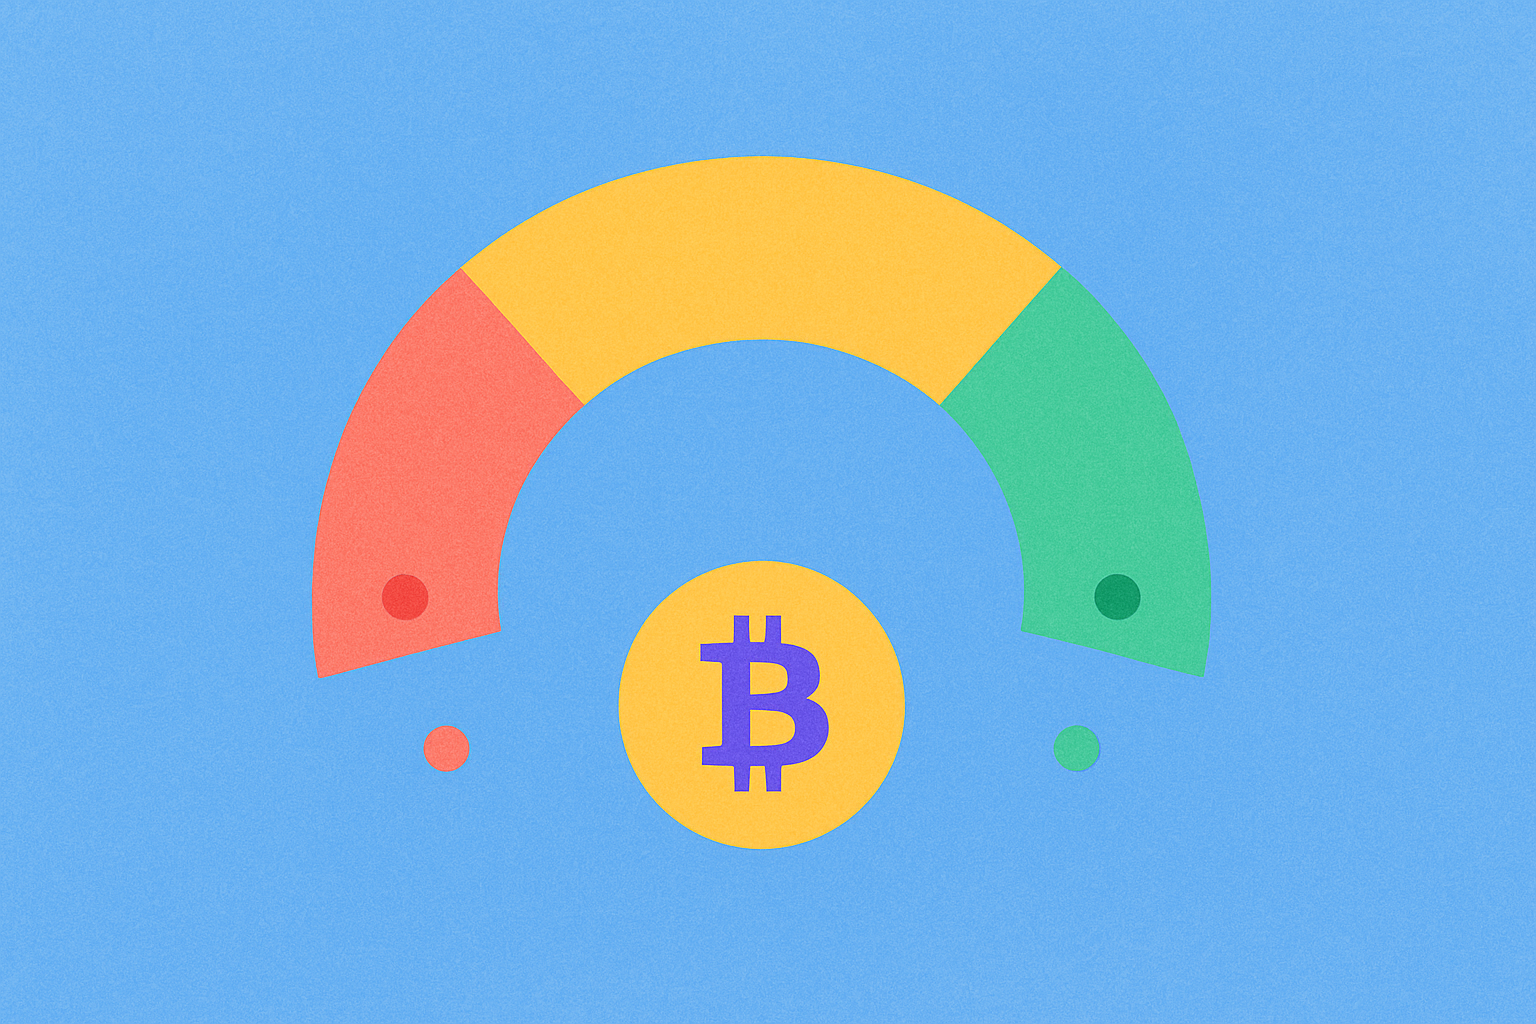
The Bitcoin Fear and Greed Index scores market sentiment on a scale from 0 to 100. Readings near 0 signal extreme fear, with investors anxious and prone to dumping assets. Readings closer to 100 indicate extreme greed, marked by over-optimism and risk-blind buying.
Mid-range scores—typically 40 to 60—reflect a neutral market, not dominated by extreme emotion. During these periods, technical factors tend to drive price action, while sentiment plays a smaller role.
This scoring system is especially useful because historical patterns show that extremes often coincide with major turning points. Extreme fear clusters around local bottoms, and extreme greed most often appears near overheated tops, where corrections are likely. That said, the index is not a precise price predictor—it simply highlights moments when sentiment may be unsustainable over the long term.
Key Components in the Calculation
The Bitcoin Fear and Greed Index draws on multiple factors—not just one data source—to present a full picture of market sentiment. Understanding these elements helps explain why the index shifts day to day:
Price Volatility: Measures how much Bitcoin’s price moves over a set period. High volatility, especially sharp drops, fuels fear. Low, stable volatility often signals investor confidence.
Market Momentum and Trading Volume: Tracks buying and selling pressure. Surging volume and rising prices are typically signs of dominant greed. Low volume during declines hints at indifference or fear.
Social Media Sentiment: Platforms like Twitter, Reddit, and crypto forums are analyzed for the emotional tone of Bitcoin discussions. Interactions, hashtags, and post sentiment all feed into the overall mood.
Bitcoin Dominance (Bitcoin Dominance): The ratio of Bitcoin’s market cap to the total crypto market. Higher dominance signals investors seeking safety—reflecting caution. Lower dominance means more risk-taking in altcoins.
Google Trends: Search data shows public interest in Bitcoin. Spikes in searches tend to happen during panic (crashes) or euphoria (rallies), both marking extremes in sentiment.
All these factors are combined and weighted to produce the final score—offering a comprehensive, multi-layered daily snapshot of market psychology.
Bitcoin Fear and Greed Index: Recent Value and Market Sentiment
Recent Value and Market Significance
During the latest analysis period, the Bitcoin Fear and Greed Index hit 11—deep in the "Extreme Fear" zone. This clearly signals that Bitcoin investors are highly cautious and strongly risk-averse. Such a low reading reflects broad pessimism across the investment community.
Just prior to this, Bitcoin saw a notable 5.5% drop, putting heavy psychological pressure on investors. This decline was driven not only by internal volatility, but also by broader macroeconomic factors.
One key influence during this period was monetary policy from major central banks. Sustained high interest rates fueled global risk aversion, leading to heavy selling pressure on risk assets like Bitcoin. Tight liquidity and economic concerns pushed selling even higher, driving fear levels up.
This extreme fear also highlights a lack of confidence in Bitcoin’s short-term outlook, with many worried about deeper price declines ahead.
Key Drivers of Recent Market Sentiment
Bitcoin market sentiment is shaped by a tangle of interconnected factors. In the period analyzed, several core elements contributed to the surge in extreme fear:
High Price Volatility: Sudden, steep drops trigger the strongest fear. When investors watch their portfolios plunge, the natural response is anxiety and selling, often fueling further downside.
Macroeconomic News: Monetary policy—especially high rates—creates headwinds for risk assets. Investors often pull funds from crypto in favor of safer options like government bonds or cash.
Regulatory Changes: Any news about stricter crypto regulations raises concerns about the industry’s future, directly affecting sentiment.
Liquidity Conditions: Reduced liquidity makes trading harder and price swings wider, leaving investors uneasy about being able to exit positions when needed.
Social Media Waves: Rumors, bearish analysis, and negative stories spread fast on social platforms, amplifying fear even if not fully substantiated.
These factors interact to create a complex psychological backdrop that the Fear and Greed Index aggregates and reflects.
Trend Comparison to Past Periods
Tracking index shifts over weeks and months gives investors clarity on changing market psychology. In this case, the index showed major volatility compared to previous periods.
Before this analysis period, the Bitcoin Fear and Greed Index was more neutral, signaling balanced sentiment. It then dropped sharply to 11—marking a clear shift from stability to extreme fear, and signaling higher uncertainty and anxiety among investors.
Such sharp moves often warn that higher volatility is coming, with increased chances of sudden swings. For investors, comparing to historical data is crucial: Is this a long-term trend change or just a short-lived emotional reaction?
History shows markets often rebound after extreme fear, when negativity peaks and investors spot bargains. However, there’s no guarantee history will repeat, and each phase has its own context that must be reviewed carefully.
Why the Fear and Greed Index Matters for Bitcoin Investors
Spotting Market Extremes
The Bitcoin Fear and Greed Index’s greatest value is helping investors recognize when market sentiment hits extremes. These are moments when decisions are driven more by emotion than by logic—often to the portfolio’s detriment.
When fear sweeps the market, many investors sell assets at any price out of panic, just as the market may be ready to reverse upward. Savvy investors look for buying opportunities here, following the “buy when others are fearful” principle.
When greed dominates, crowds rush in hoping for quick profits—often ignoring warning signs of overvaluation or hidden risk. The market then risks overheating and correcting. Smart investors often take profits or reduce exposure when greed peaks.
Past market cycles repeatedly confirm this link. Extreme fear usually matches local or major bottoms; extreme greed appears near tops before corrections. While not always perfect, these are valuable signals to integrate into strategy.
Recognizing extremes helps investors avoid impulsive, emotion-driven choices—protecting capital and improving long-term returns.
Using the Index as a Support Signal
Experienced traders and investors never rely on a single indicator. The Bitcoin Fear and Greed Index works best alongside technical and fundamental analysis tools, forming a robust decision-making framework.
When the index shows high greed, investors should also check price charts for key resistance levels. If prices are hitting strong resistance while greed is high, it may signal a coming correction. Investors should be cautious, consider profit-taking, or set tighter stop-losses.
Likewise, if the index flags extreme fear, checking for strong support zones helps confirm accumulation opportunities. If prices bounce from historical support while fear peaks, this could be a compelling buy entry.
Technical indicators like moving averages, RSI, BTC/USDT volume, and candlestick patterns can help confirm or reject the index’s signals. Combining multiple tools increases reliability and lowers single-point risk.
Fundamental factors—macroeconomic news, blockchain updates, and major crypto events—should also inform decisions. The Fear and Greed Index offers a sentiment snapshot, but only delivers maximum value in broader market context.
Avoiding Common Mistakes
A frequent error with the Bitcoin Fear and Greed Index is misreading its signals. Many newcomers assume extreme fear means “buy now,” and extreme greed means “sell now.” But the reality is more nuanced.
Sentiment alone cannot reverse a prevailing price trend. A strong downtrend can sustain extreme fear for weeks or months if fundamentals remain weak. Buying just because the index shows fear can lead to losses if prices keep dropping.
Likewise, strong uptrends can keep greed high. Selling too soon out of fear of greed can cost investors much of a rally’s gains.
Always assess the broader picture before acting. What’s the overall trend? Are macro factors helping or hurting Bitcoin? How’s liquidity? Are major news events looming? Answering these gives a holistic view.
Another mistake is expecting the index to predict exact turning points. It describes current sentiment—it doesn’t forecast the future. Use it as one input in a multi-factor analysis, paired with strict risk management.
Finally, don’t let your own emotions be dictated by the index. Extreme fear doesn’t mean you must be fearful, and the reverse is also true. Aim to use the data objectively, making logic- and strategy-based decisions.
Tips for Using the Fear and Greed Index in Bitcoin Investing
Long-Term Investors
For long-term holders (Hold or HODLing), use the Bitcoin Fear and Greed Index as a strategic guide—not a daily trading signal. Long-term investors focus on accumulating at good prices over time, not chasing short-term moves.
Extreme fear phases are ideal for dollar-cost averaging (DCA). When the market panics and prices drop, it’s a good time to buy below the average price. Stay disciplined—don’t invest all at once, but spread purchases to hedge against further declines.
When greed peaks and the market overheats, consider slowing or pausing buying. This is also a time to take profits if targets have been met.
Checking the index weekly or monthly (instead of daily) helps long-term investors ignore short-term sentiment swings and maintain strategic focus.
Short-Term Traders
Active traders can use the Fear and Greed Index to spot opportunities based on emotional extremes that may signal short-term reversals. These traders focus on capturing daily or weekly moves and need tools for precise entries and exits.
When greed rises and prices near key resistance, it may signal an imminent short-term pullback. Traders might open shorts or take profit on longs.
When fear spikes and prices test strong support, it may be time to open longs for a potential bounce. Combine this with technical patterns, RSI/MACD divergences, and volume confirmation.
Short-term traders should use tight stop-losses to protect capital if the market doesn’t move as expected. The index is just one tool—don’t skip detailed technical analysis or risk controls.
Risk Management
The Fear and Greed Index is invaluable for risk management and strategic adjustment. Sentiment shapes how much risk investors should accept.
When greed is high, volatility and correction risk rise. Tighten risk controls: set closer stop-losses, lower leverage if margin trading, and consider taking partial profits. Reducing exposure during high greed protects portfolios from sudden corrections.
When fear is high, it may be a buying opportunity, but caution is key. Avoid panic selling with the crowd. Re-examine fundamentals—is the fear justified or a temporary emotional reaction? Is there negative news truly impacting Bitcoin’s long-term value?
Adjusting position size based on the index is also effective. Maintain standard size during neutral periods; reduce exposure when extremes appear.
Remember, no tool eliminates risk entirely. The Fear and Greed Index is part of a full risk management system—diversification, never over-investing, and always having contingency plans.
Limitations of the Fear and Greed Index
The Bitcoin Fear and Greed Index is useful, but investors should be aware of its limitations to prevent misuse or misinterpretation.
Oversimplifying Complex Psychology: Crypto markets contain millions of investors with differing motives and information. Compressing all this sentiment into a single 0–100 number omits important nuances. The index cannot capture the differences between small retail traders, professionals, and institutions—all of whom may act differently at the same time.
Short-Term Focus: The index is designed to react quickly to news, price changes, and social media. It’s a good short-term indicator, but not suited for predicting long-term trends. Multiple fear and greed cycles can occur within a broader bull run. Long-term investors should combine the index with fundamental analysis of technology, adoption, and macroeconomics.
Context Matters: Sentiment does not exist in isolation. Extreme fear after a mild recovery means something very different than fear during a global crisis or major regulatory crackdown. Always place the index in the wider context, including:
- Macroeconomic Environment: Interest rates, inflation, central bank policies
- Regulatory Situation: New or changing tax/crypto regulations
- Market Liquidity: Trading volume, activity on major exchanges
- Major Events: Bitcoin halving, tech upgrades, institutional involvement
Knowing these limitations helps investors use the index wisely—as part of a multi-pronged analysis, not a one-size-fits-all solution.
Tools to Track the Bitcoin Fear and Greed Index
Real-Time Dashboards
Fast, reliable data access is vital for investors. Many online platforms now offer daily Bitcoin Fear and Greed Index updates, with visualization tools for easy tracking and analysis.
Crypto data sites typically display the index as a gauge or colored bar, so investors can quickly assess market sentiment. Most sites also offer historical charts for day, week, or month comparisons—helping spot trends and recurring patterns.
Advanced platforms integrate the index with technical tools, letting investors view sentiment alongside price, volume, and other indicators for a holistic market view.
Mobile apps are increasingly popular, allowing investors to monitor the index anytime and receive alerts when it hits extreme levels—a useful feature for catching opportunities as they arise.
Supplementary Tools
For a complete view of market sentiment, combine the Fear and Greed Index with other tools:
Funding Rates: In futures trading, funding rates reveal the balance between long and short positions. High positive rates suggest optimism; high negative rates indicate strong selling pressure.
Open Interest: The value of outstanding futures and options contracts. Rising open interest shows growing market engagement; falling open interest may suggest apathy or profit-taking/loss-cutting.
Whale Activity: Tracking large wallet transactions helps identify big investor behavior. Whale accumulation can be bullish; distribution warrants caution.
Social Media and News Tracking: Sentiment analysis on Twitter, Reddit, and crypto forums gauges community mood in real time. Spikes in positive or negative keywords often signal changing sentiment.
Other Indices: Metrics like Bitcoin Dominance, MVRV, and on-chain analytics offer further market insights.
Combining these sources lets investors build a fuller picture of sentiment and trends—supporting sound investment decisions.
How Often to Check
Check frequency depends on your investment style:
Active Traders: Short-term traders seeking daily volatility should check the index daily or even multiple times a day to catch sentiment shifts quickly.
Swing Investors: Those holding positions for days or weeks can check several times a week to monitor broad sentiment trends without reacting to daily noise.
Long-Term Investors: Buy-and-hold investors need only check weekly or monthly, helping them ignore short-term swings and stay focused on their plan.
Don’t let index-watching cause unnecessary stress. Use it to support your strategy, not to create anxiety. Find a frequency that matches your goals and approach, remembering the index is just one piece of the puzzle.
Conclusion
The Bitcoin Fear and Greed Index is a powerful tool for crypto investors. It offers a rapid, visual read on market sentiment and helps pinpoint when emotions reach extremes—potentially signaling opportunity or risk.
But remember, it’s no crystal ball. The index won’t tell you exactly when to buy or sell—it offers context for prevailing sentiment. Its real value is helping you spot when emotions may be unsustainable, encouraging more cautious, data-driven decisions.
For best results, pair the index with technical analysis tools like trendlines, chart patterns, RSI, and MACD. Always factor in macroeconomic trends, regulatory news, and the long-term trajectory of blockchain and crypto markets.
Risk management comes first. No matter what the index shows, always use stop-losses, don’t risk more than you can afford, and keep your portfolio diversified. The Fear and Greed Index can guide when to adjust exposure, but it’s no substitute for a comprehensive risk management strategy.
Success in Bitcoin investing isn’t about perfectly timing every market move—it’s about having a clear plan, sticking to it, and managing your emotions. The Fear and Greed Index is a valuable resource for making logic-driven, data-backed decisions instead of reacting to market noise.
By understanding how it works, using it wisely, and knowing its limits, you can make it a cornerstone of your Bitcoin investment strategy—boosting your odds of success and mitigating risk in this dynamic market.
FAQ
What is the Bitcoin Fear and Greed Index? How is it calculated?
The Bitcoin Fear and Greed Index quantifies market sentiment from 0 (extreme fear) to 100 (extreme greed). It’s calculated using recent price volatility, trading volume, social media analytics, and search trends to assess overall market psychology.
What is the range and meaning of the Bitcoin Fear and Greed Index?
It ranges from 0–100: 0–24 means extreme fear, 25–49 is fear, 50–74 is greed, and 75–100 is extreme greed.
How do you use the Fear and Greed Index to guide Bitcoin investment decisions?
The index measures Bitcoin market sentiment. Extreme fear often signals attractive buying opportunities, while extreme greed may warn of an upcoming correction. Use it alongside technical analysis for more informed decisions.
What’s the relationship between the Fear and Greed Index and Bitcoin price trends?
The index tracks market psychology and correlates closely with Bitcoin price. High readings (greed) usually mean upward price momentum; low readings (fear) often signal declines. It’s a key sentiment indicator.
What’s the current level of the Bitcoin Fear and Greed Index? What is market sentiment like?
The Bitcoin Fear and Greed Index is currently at 42, nearly neutral. Sentiment is mixed, traders are divided, and uncertainty is high—the market could move in either direction.

How to Interpret Technical Indicators for Crypto Trading Success?

How to Use MACD and RSI Indicators for Bitcoin Price Analysis?

Understanding Bitcoin Trends: A Guide to Cryptocurrency Chart Analysis

Comprehensive Guide to Identifying Bitcoin Trading Patterns
Mastering Bitcoin Short Selling: Effective Strategies for Crypto Traders

How Do Derivatives Market Signals Impact Cryptocurrency Price Movements?
Can I Start Trading with R200?

Hamster Kombat Daily Combo Cards Guide
Is Dogecoin a Good Investment?

Is Ethereum Mining Profitable?

How to Trade Crypto Options in the US