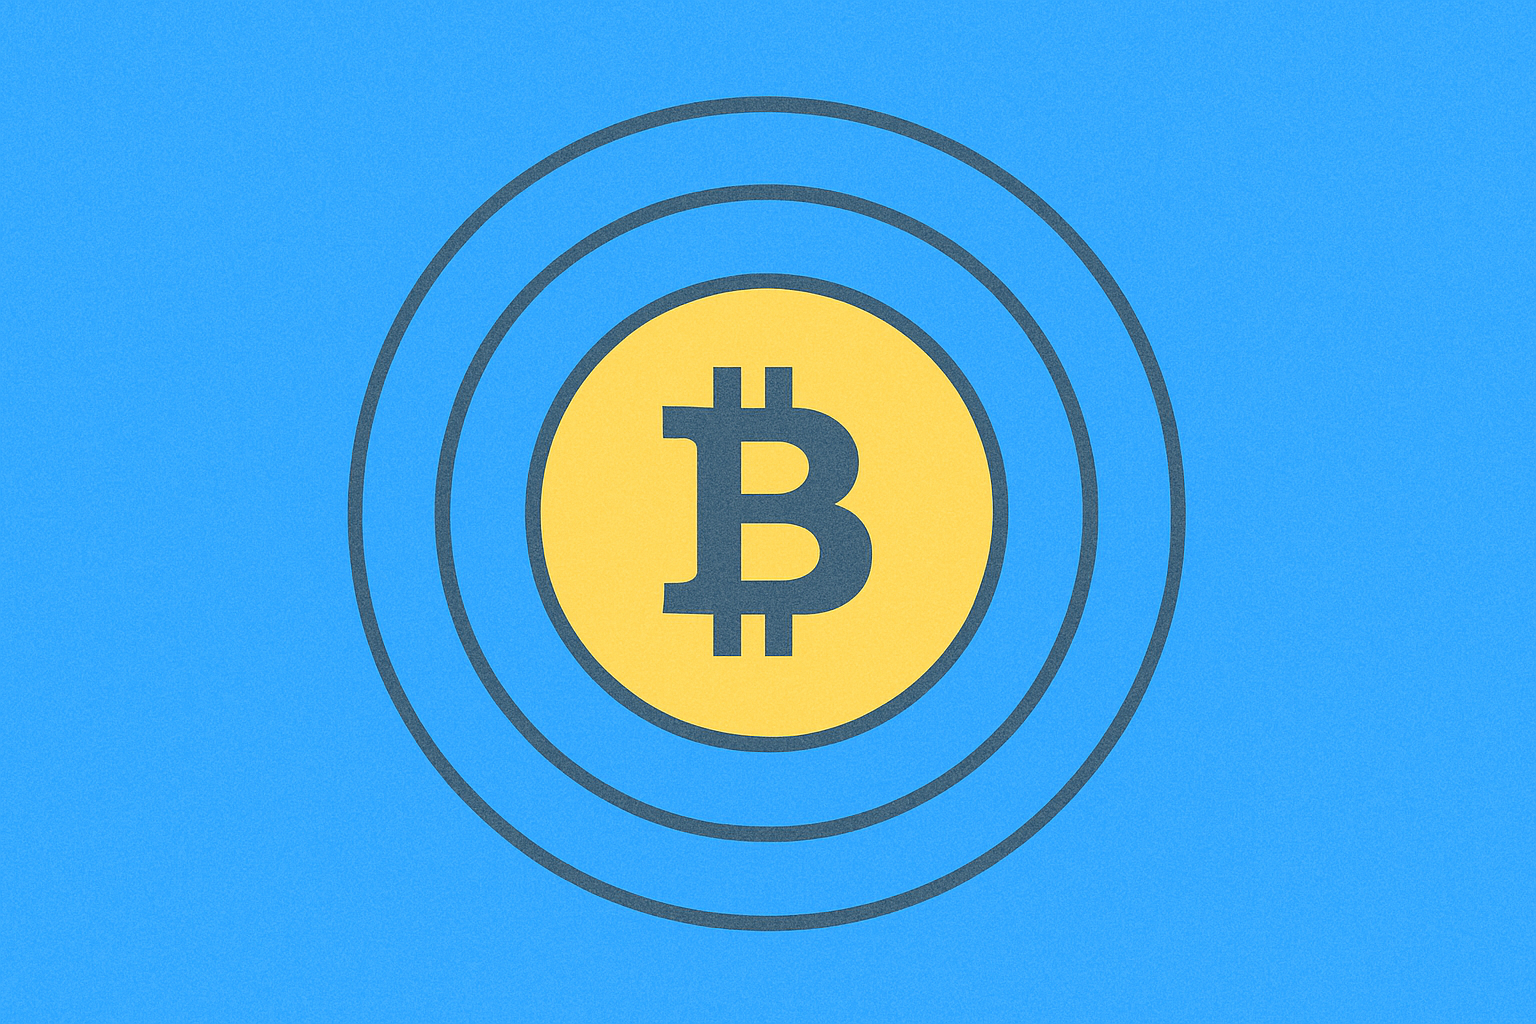
The Crypto Fear and Greed Index: Definition, Mechanism, and Where to Track It Online

What Is the Fear and Greed Index?
The Cryptocurrency Fear and Greed Index is a vital tool for traders and investors to gauge market sentiment and make informed decisions. This indicator captures the emotional climate of market participants, highlighting potential entry and exit opportunities.
Simple Explanation
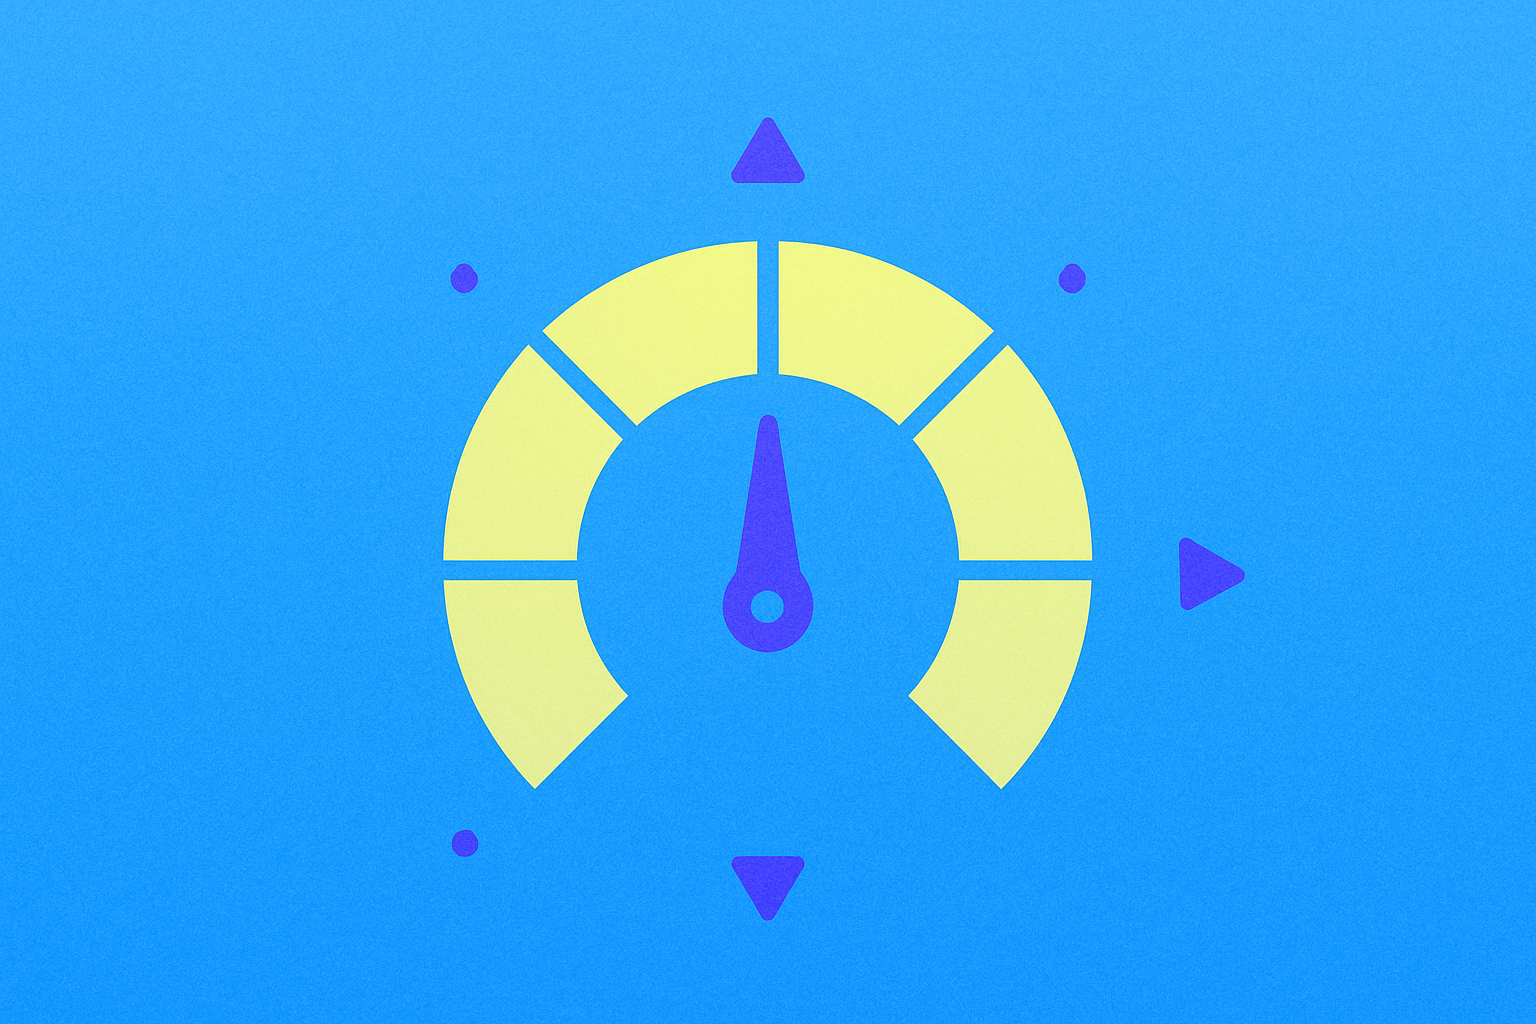
The Fear & Greed Index is a numerical indicator that reflects the emotional state of cryptocurrency market participants. It ranges from 0 to 100, where:
- 0 — Extreme fear, signaling panic selling and possible asset undervaluation.
- 100 — Extreme greed, indicating the market is overbought and a correction may be imminent.
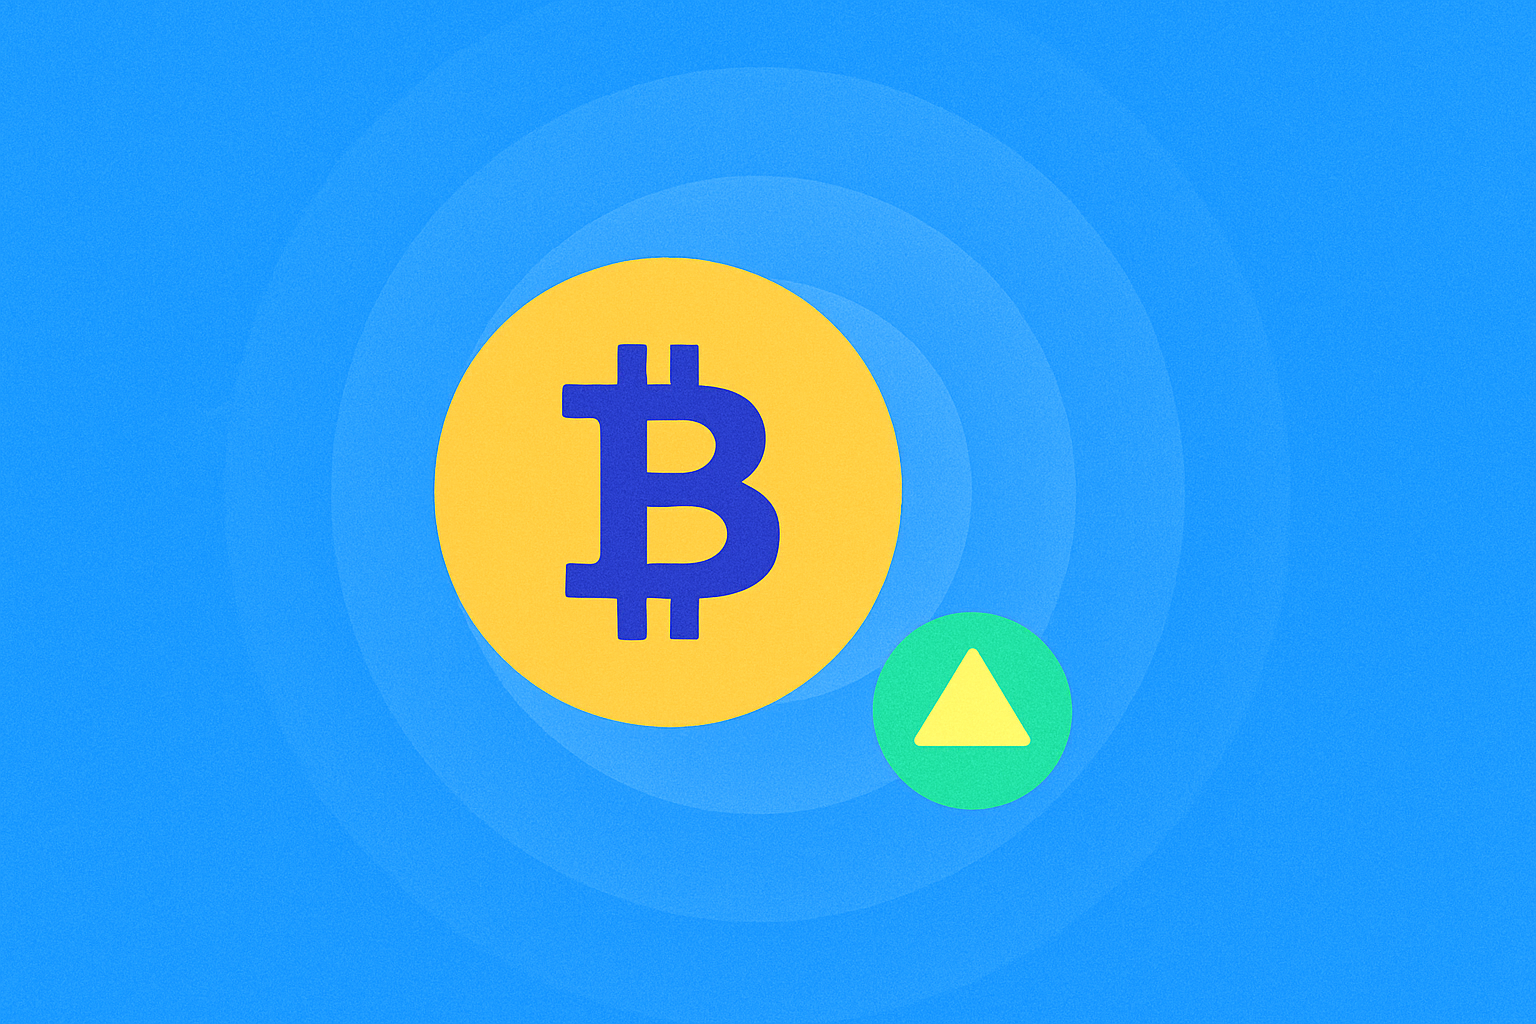
This index originated in the traditional stock market, first introduced by CNNMoney, and was later adapted for crypto. In the digital asset space, it centers on Bitcoin (BTC), whose price movements often set the tone for the broader market.
What "Fear" and "Greed" Mean in the Market
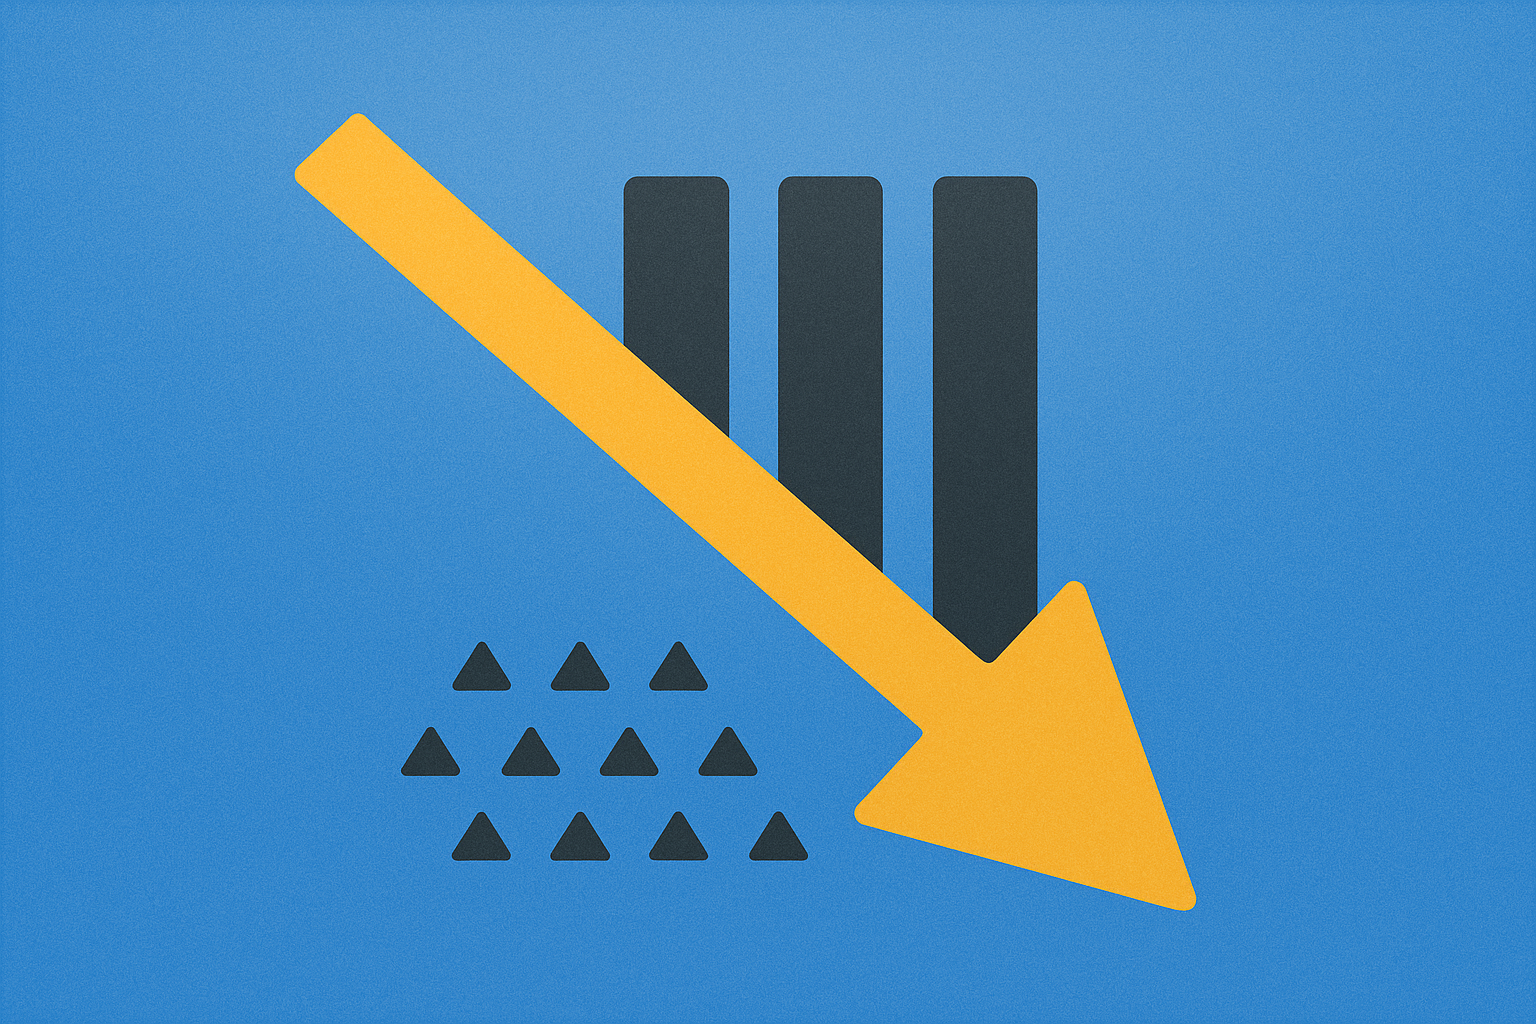
Fear: When fear dominates the market, investors worry about further price drops. This drives widespread selling, weakens demand, and often leads to undervalued assets. Such fear can suggest an oversold market, which many see as a buying opportunity.
Greed: Greed takes hold when markets rally and traders, influenced by FOMO (fear of missing out), aggressively buy. This behavior can inflate asset prices and signal that a correction is near.
These emotions directly impact trader behavior, making the index a crucial gauge of market psychology.
Why the Index Matters for Crypto Traders and Investors
The Fear and Greed Index helps traders and investors to:
- Identify Market Trends: Low readings (fear) can identify entry points; high readings (greed) can signal potential exits.
- Control Emotions: The index helps traders avoid impulsive moves triggered by FOMO or FUD (fear, uncertainty, doubt).
- Apply Contrarian Strategies: As Warren Buffett recommends, "be greedy when others are fearful and fearful when others are greedy." The index supports these contrarian approaches.
How the Cryptocurrency Fear and Greed Index Works
Key Metrics Used in Calculation
The Fear and Greed Index draws from several core metrics, each weighted to produce the final score. The primary factors include:
- Volatility (25%): Assesses current Bitcoin volatility and drawdowns against 30- and 90-day averages. High volatility signals fear; low volatility indicates greed.
- Trading Volume (25%): Compares current volumes with 30-/90-day averages. Rising volume points to increased buying and market greed.
- Social Media (15%): Tracks Bitcoin and other crypto mentions on platforms like X. High activity and positive sentiment reflect greed; negative sentiment signals fear.
- Market Surveys (15%): Some platforms use trader surveys to measure sentiment (though this is less common).
- Bitcoin Dominance (10%): A rising BTC market cap share signals fear, as investors seek "safer" assets. Falling dominance signals greed and a shift toward altcoins.
- Google Trends (10%): Analyzes Bitcoin-related search queries. Increased searches like "Bitcoin price manipulation" suggest fear, while "how to buy Bitcoin" reflects greed.
Data Sources
The index aggregates data from multiple sources:
- Market Data: Prices, volumes, and volatility from major crypto exchanges and reputable data providers.
- Social Media: Analyzes posts across X, Reddit, and Telegram.
- Search Engines: Google Trends tracks search term popularity.
- Surveys: Platforms like CoinStats collect trader sentiment through polls.
Update Frequency
The index is typically updated daily, though some sources like CoinStats refresh data every 12 hours. This provides traders with near real-time sentiment shifts.
Where to Track the Fear and Greed Index Online
Popular Sites
Reliable sources for monitoring the Fear and Greed Index include:
- Alternative.me: A leading site offering daily Bitcoin index updates. It features current readings, historical data (7, 30, 90 days, and 1 year), and trend charts.
- CoinMarketCap: Offers its own Fear and Greed Index with a developer API. Daily updates include historical analysis.
- CoinStats: Updates every 12 hours and provides BTC and altcoin sentiment charts.
How to Track Using TradingView
TradingView does not natively support the Fear and Greed Index, but traders can:
- Deploy custom Pine Script code to import index data from APIs like CoinMarketCap.
- Analyze related indicators such as volatility or volume, available directly in TradingView charts.
- Monitor TradingView news feeds and community sentiment to gauge market emotions indirectly.
Mobile Apps and Widgets
Traders can access the index through various mobile apps and widgets:
- CoinStats: Features a Fear and Greed Index widget for iOS and Android.
- Blockfolio: Displays overall market sentiment and supports index integration.
- Widgets: Alternative.me and similar sites offer HTML widgets for embedding the index on personal sites or trading dashboards.
Bitcoin and Crypto Greed Index: Value Analysis
Index Trends for BTC and Altcoins
Historically, the Bitcoin Fear and Greed Index exhibits cyclical swings between extremes. During bullish periods, the index enters greed territory (values 51–100), signaling strong BTC price rallies and higher trading volumes.
The index is less standardized for altcoins, as calculations are generally BTC-centric. However, altcoin sentiment often tracks Bitcoin due to high market correlation. For example:
- When BTC dominance rises, altcoins may face fear-driven outflows.
- As BTC dominance drops, altcoins display greed as capital shifts into riskier assets.
Comparison with the Stock Market
The crypto Fear and Greed Index is similar to the CNNMoney stock market indicator but with key differences:
- Volatility: Crypto markets are far more volatile, making their index more responsive. Historically, the index has plunged during market turmoil and quickly rebounded as demand returned.
- Data Sources: The stock index relies on equities, options, and bond volatility, while the crypto index incorporates social media and Google Trends data.
How to Use the Fear and Greed Index in Trading
Buy-on-Fear and Sell-on-Greed Strategies
The Fear and Greed Index is a powerful addition to spot and futures trading strategies. Key approaches include:
Buy on Fear
- When to Apply: The index shows extreme fear (0–24) or fear (25–49), signaling oversold assets and potential undervaluation.
- Strategy Example:
- Check the index reading on Alternative.me. A value below 24 signals panic.
- Analyze BTC/USDT charts on the 1-hour or 4-hour timeframe using RSI and MACD to confirm a reversal.
- Open a long position with a limit order at support, placing a stop-loss 1–2% below entry.
- Target take-profit at the nearest resistance or when the index returns to 50 (neutral zone).
- Historical Example: After periods of extreme fear, the market often rebounded with strong BTC rallies in subsequent months, offering attractive entry points for long-term investors.
Sell on Greed
- When to Apply: The index indicates greed (51–74) or extreme greed (75–100), suggesting overbought conditions and a likely correction.
- Strategy Example:
- Monitor the index on CoinMarketCap. Readings above 75 indicate an overheated market.
- Analyze ETH/USDT charts and check indicators such as RSI (>70) or Bollinger Bands (price at the upper band).
- Open a short futures position with 5x–10x leverage and a stop-loss 1–2% above entry.
- Set take-profit at support or once the index falls to 50.
- Historical Example: During extreme optimism (index >80), markets often corrected by 15–30% from local highs, creating profitable shorting opportunities.
Contrarian Approach
- Apply Warren Buffett’s maxim and use the index to spot extremes, confirming with technical analysis.
- At index 10 (extreme fear), seek spot entries for long-term BTC/ETH positions. At index 90 (extreme greed), lock in gains or enter short futures trades.
Combining with Other Tools
- Supplement the index with TradingView indicators like:
- RSI: Confirms overbought/oversold markets.
- MACD: Identifies trend reversals.
- Volume: Measures move strength.
Practical Tips for Traders
- Don’t Rely Solely on the Index: It’s helpful, but always combine it with technical and fundamental analysis.
- Use Demo Accounts: Test strategies in a simulator to see how the index affects your trades.
- Review Historical Data: Analyze past index and BTC price correlations using CoinMarketCap or Alternative.me.
- Manage Risk: Set stop-losses and avoid leverage above 10x on futures to prevent liquidation.
- Monitor Social Media: Check sentiment on X or Telegram to validate index signals.
Conclusion
The Cryptocurrency Fear and Greed Index is a powerful gauge of market sentiment, empowering traders to make smarter decisions. By identifying extreme emotions like fear or greed, you can uncover strategic buy or sell opportunities. Track the index via Alternative.me or CoinMarketCap, combine it with technical analysis, and manage risk to boost your crypto trading success.
FAQ
What is the Cryptocurrency Fear and Greed Index and how is it calculated?
The Fear and Greed Index quantifies crypto market sentiment on a 0–100 scale. It combines trading volume, social media activity, and search trends. Low readings signal fear, high readings indicate greed. The index helps investors assess sentiment and anticipate price moves.
What is the value range of the Fear and Greed Index? What do the different values mean?
The Fear and Greed Index runs from 0 to 100: 0–25 = extreme fear, 25–45 = fear, 45–55 = neutral, 55–75 = greed, 75–100 = extreme greed. Each range reflects prevailing investor sentiment.
How can you use the Fear and Greed Index to make investment decisions?
When the index shows high fear, consider buying undervalued assets. When greed is high, consider taking profits. Use the index to monitor sentiment and identify entry and exit opportunities.
Where can you view the cryptocurrency Fear and Greed Index in real time?
You can view the Fear and Greed Index on CoinMarketCap, which offers real-time sentiment data and historical analytics via API to support informed investment decisions.
How does the Fear and Greed Index relate to Bitcoin price trends?
The index gauges market sentiment: values of 0–49 indicate undervaluation, while 50–100 suggest overbought conditions. Bitcoin price often moves inversely to the index, with reversals common at extremes. Use it as a supplemental analysis tool.
What influencing factors are included in the Fear and Greed Index?
The index incorporates market volatility, put/call ratio, safe-haven demand, trading volume, and momentum indicators. These factors reveal investor sentiment and help identify market extremes.
How should you act when the index shows extreme fear or greed?
When extreme fear appears, consider buying—the market is oversold. During extreme greed, be cautious—a correction may be likely. Always combine with other analytical tools for best results.
Does the Fear and Greed Index provide reference value for long-term investors?
Yes, the index offers valuable insights for long-term investors. Extreme fear (0–24) can signal buying opportunities, while extreme greed (75–100) calls for caution. Always use it alongside other analytical tools—not as your sole decision factor.

How Will Zcash (ZEC) Price Volatility Impact Its 2025 Performance?

How Will Litecoin (LTC) Price Evolve in 2030 Based on Current Market Trends?

What Factors Are Driving the Current Price Volatility in the Crypto Market?
Bitcoin's Influence on Alternative Cryptocurrencies
How Does Cryptocurrency Price Volatility Compare to Traditional Markets?
How to Use MACD, RSI, and Bollinger Bands for Crypto Price Prediction?

What Crypto Will Explode: An Insightful Perspective into Digital Assets' Future
How Do I Bet Against the Stock Market: Beginner's Guide

How to Identify Gold in Electronics: A Beginner's Guide
How Long Does USDC Take to Transfer: A Comprehensive Guide
How to Find Your Bitcoin Address on Cash App