LCP_hide_placeholder
fomox
MarketsPerpsSpotSwapMeme Referral
More
Smart Money Recruitment
Search Token/Wallet
/

Dogecoin Analysts Predict 315% Upside as Price Eyes $0.6533 Target

2026-01-21 23:16:35
Price Prediction
Altcoins
Crypto Insights
Crypto Trading
Doge
Article Rating : 4
177 ratings
This article provides a comprehensive analysis of Dogecoin's price potential, with expert predictions indicating over 300% growth toward a $0.6533 target. The analysis combines technical formations—including a bullish rounded base pattern and breakout from prolonged downtrends—with critical support levels at $0.08 and key resistance at $0.20. Analyst Javon Marks highlights the $0.1595 momentum threshold as pivotal for validating upward momentum. Beyond technical indicators, fundamental metrics including rising Total Value Locked and improved user engagement since 2023 strengthen the bullish case. The article examines Dogecoin's advantages over Bitcoin and Ethereum, market liquidity factors, and essential risk considerations for investors evaluating positions through reliable platforms like Gate, offering both opportunity assessment and practical investment guidance.
Dogecoin Analysts Predict 315% Upside as Price Eyes $0.6533 Target

Technical Analysis and Price Predictions

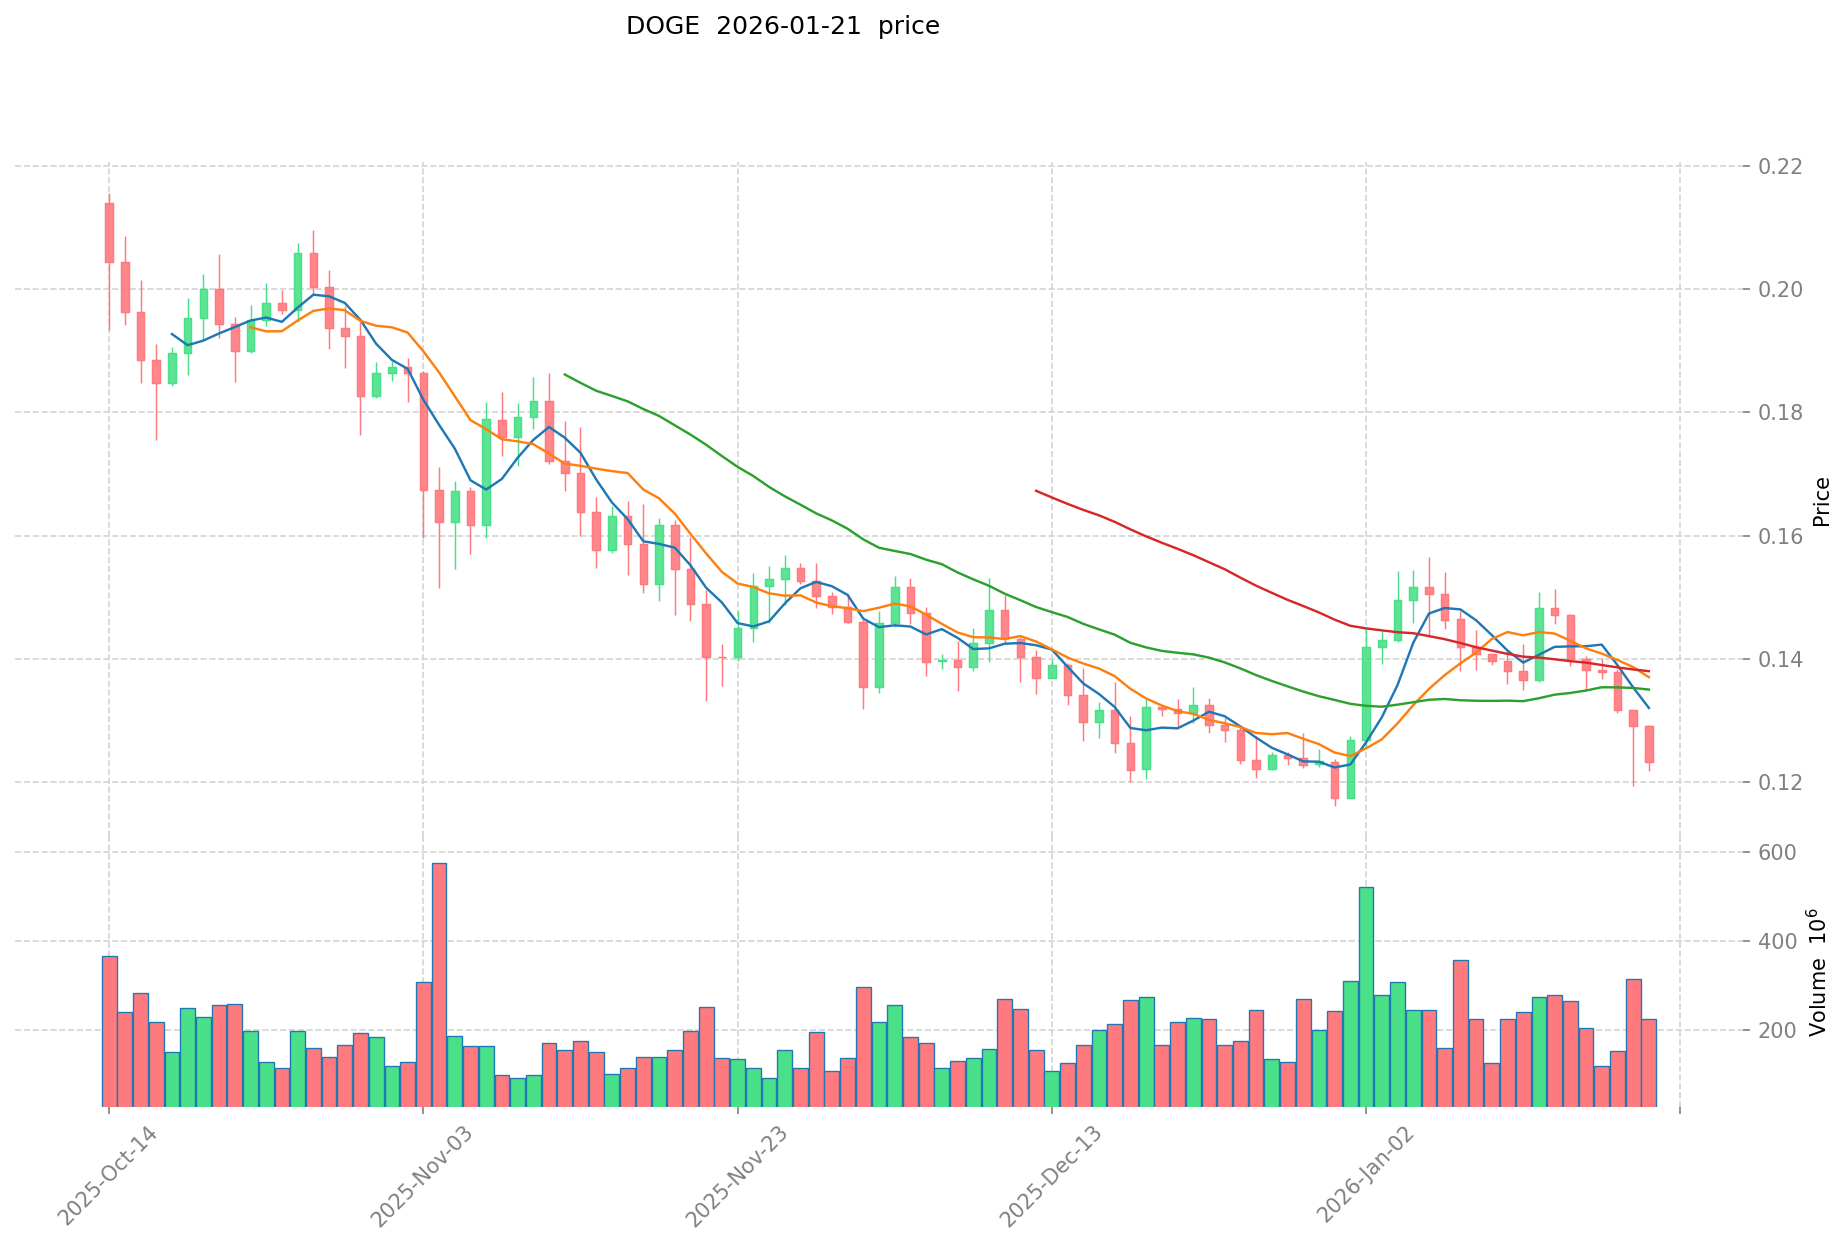
Dogecoin (DOGE) is currently demonstrating a compelling bullish trend characterized by a pattern of higher lows and controlled price recoveries. Market analysts have identified a significant upside potential, projecting that DOGE could move toward a price target of $0.6533. This ambitious target represents approximately 315% increase from recent trading levels, suggesting substantial room for growth in the coming period. image_url

Cryptocurrency analyst Javon Marks has provided detailed technical insights into this bullish outlook. According to his analysis, DOGE has successfully broken out of a prolonged downtrend that had constrained price action for an extended period. This breakout is particularly significant as it signals a potential shift in market sentiment and establishes a foundation for sustained upward momentum.

Key Support and Resistance Levels

Understanding the critical price levels is essential for evaluating Dogecoin's potential trajectory. Analysts have identified several key technical zones that will likely influence price movement in the near term.

The primary support level has been established near the $0.08 mark, representing a foundational price floor that has historically provided buying interest. This level serves as a crucial safety net for the bullish structure, offering a point of stability during market corrections.

On the resistance side, the $0.20 level has emerged as a significant barrier that DOGE must overcome to confirm the continuation of its bullish trend. Breaking through this resistance zone would likely trigger additional buying pressure and validate the higher price targets proposed by analysts.

Perhaps most importantly, the $0.1595 level has been identified as a critical momentum threshold. This price point represents a pivotal zone where market dynamics could shift decisively. Successfully maintaining price action above this level would strengthen the bullish case and provide confidence for the move toward the $0.6533 target.

Market Structure and Trend Analysis

The technical formation underlying Dogecoin's current price action reveals a classic rounded base pattern. This chart structure typically indicates a gradual accumulation phase followed by a sustained rise, suggesting that institutional and retail investors have been building positions over time.

The rounded base formation is particularly bullish because it represents a methodical shift from selling pressure to buying interest. Unlike sharp V-shaped reversals, which can be volatile and short-lived, rounded bases tend to produce more sustainable uptrends as they reflect a fundamental change in market psychology.

The breakout from the long-term downtrend further reinforces this bullish structure. When a cryptocurrency successfully breaks a prolonged downtrend, it often signals that the previous bearish forces have been exhausted and that new bullish momentum is taking control. This technical development is crucial for validating the ambitious price targets that analysts have projected.

Fundamental Growth Indicators

Beyond technical analysis, several fundamental factors support the developing bullish structure for Dogecoin. One of the most significant indicators is the growth in Total Value Locked (TVL), which has shown consistent expansion in recent periods. Rising TVL suggests increasing utility and adoption of Dogecoin-related protocols and applications, reflecting growing confidence in the ecosystem.

Additionally, user engagement metrics have demonstrated notable improvement since 2023. This rising engagement encompasses various aspects of the Dogecoin network, including transaction volume, active addresses, and community participation. These fundamental indicators provide substance to the technical bullish signals and suggest that the projected price appreciation is supported by genuine growth in network activity and adoption.

The combination of strong technical patterns, clearly defined support and resistance levels, and improving fundamental metrics creates a compelling case for Dogecoin's potential upside. While cryptocurrency markets remain inherently volatile and unpredictable, the current structure suggests that DOGE may be positioned for a significant price appreciation phase in the coming period.

FAQ

Why are analysts bullish on Dogecoin? What factors underpin the 315% upside prediction?

Analysts highlight Dogecoin's strong community support, growing mainstream adoption, technical momentum, and increasing institutional interest. The 315% upside projection is based on bullish technical breakouts, rising trading volume, positive market sentiment, and potential network upgrades driving the price target to $0.6533.

How is Dogecoin's $0.6533 target price calculated? What technical analysis methods are used?

The $0.6533 target is derived from Fibonacci retracement levels, resistance breakout analysis, and moving average convergence combined with volume-weighted price action patterns, projecting a 315% upside from current levels.

What are the risks of investing in Dogecoin to reach the $0.6533 target price? What should I pay attention to?

Market volatility and sentiment shifts pose primary risks. Monitor technical resistance levels, trading volume trends, and macroeconomic factors. Diversify portfolio allocation and set clear entry/exit strategies. Consider long-term fundamentals beyond price predictions.

What are the advantages and disadvantages of Dogecoin compared to mainstream coins like Bitcoin and Ethereum?

Advantages: Faster transaction speed, lower fees, strong community support, and higher accessibility. Disadvantages: Lower market capitalization, less institutional adoption, simpler technology, and higher price volatility compared to Bitcoin and Ethereum.

What is the current market liquidity and trading volume of Dogecoin? Is it suitable for large investments?

Dogecoin maintains robust liquidity with substantial daily trading volume, reflecting strong market interest. Its widespread adoption across platforms ensures consistent transaction flow. For large investments, the coin's established ecosystem and community support make it viable, though position sizing should align with individual risk tolerance and investment strategy.

What is the technical foundation of Dogecoin? What are its long-term development prospects?

Dogecoin uses Scrypt proof-of-work consensus, forked from Litecoin with faster block times. Its community-driven development and merchant adoption support long-term growth potential, with analysts predicting significant upside as mainstream adoption increases.

* The information is not intended to be and does not constitute financial advice or any other recommendation of any sort offered or endorsed by Gate.

Share

Content

Technical Analysis and Price Predictions

Key Support and Resistance Levels

Market Structure and Trend Analysis

Fundamental Growth Indicators

FAQ

Related Articles
What is on-chain data analysis and how does it predict Dogecoin price movements?

What is on-chain data analysis and how does it predict Dogecoin price movements?

# Introduction On-chain data analysis provides data-driven insights into Dogecoin price movements by examining network activity, whale transactions, and trading volume metrics. This guide reveals how active addresses, holder distribution, and exchange flows function as predictive indicators for DOGE price direction. Designed for traders and investors seeking to distinguish genuine network fundamentals from speculative sentiment, the article explores critical on-chain metrics including the 662.5K monthly active addresses, top holder concentration at 43%, and volume collapse signals. By analyzing whale movements, transaction patterns, and support level breakdowns through Gate's on-chain tools, readers gain actionable intelligence to predict DOGE price trends and optimize trading decisions.
2026-01-01 01:02:41
What Is the Price Prediction for ATA Token in 2025?

What Is the Price Prediction for ATA Token in 2025?

This article examines the price trajectory and potential for the ATA token in 2025, exploring predictions based on recent volatility, historical performance, and market analysis. It addresses key concerns for cryptocurrency investors, such as ATA's price fluctuations, all-time highs, and forecasted ranges. Structured around detailed market data, the article guides readers through trends, analytics, and predictions, offering insights into investment prospects and market dynamics. It highlights ATA's future positioning amidst privacy-focused blockchain solutions, appealing to investors seeking informed decision-making. Keywords such as volatility, analysis, and price prediction optimize its readability and relevance.
2025-12-07 03:20:43
What Will Be the Price of HYPE in 2025 According to Predictions?

What Will Be the Price of HYPE in 2025 According to Predictions?

This article delves into the market dynamics and future potential of HYPE, highlighting its current price fluctuations and technical indicators that suggest possible price breakouts. It provides an in-depth analysis of HYPE's past performance, market sentiment, and technical trends, predicting a value of $45.57 by the end of 2025. Readers interested in cryptocurrency trends and investment opportunities will find valuable insights into HYPE's market position and long-term growth potential. It also examines HYPE’s price journey up to 2025 and projects its trajectory towards 2030, offering a comprehensive look at the cryptocurrency’s potential for investors.
2025-11-04 02:43:47
How Will Dogecoin (DOGE) Price Fluctuate in 2025?

How Will Dogecoin (DOGE) Price Fluctuate in 2025?

The article analyzes Dogecoin's price movements in 2025, focusing on its stabilization around $0.18 and factors influencing potential future shifts. It examines support levels, technical analysis, and market sentiment, providing insights into possible downward trends and recovery scenarios. Key topics include support zones, whale selling patterns, and long-term investor exit strategies. Traders and investors interested in DOGE's market trends and forecasts will find valuable data-driven analysis. The article utilizes a logical sequence to discuss price stabilization, support breaks, and the impact of major selling activities.
2025-11-04 01:26:44
How Do MACD and RSI Indicators Signal a Bullish Trend for DOGE Price?

How Do MACD and RSI Indicators Signal a Bullish Trend for DOGE Price?

Explore how MACD and RSI indicators signal bullish momentum for Dogecoin as it stays above $0.265. Analyze DOGE's price action to identify key support at $0.2488 and potential for a 30% surge if it breaks $0.25 resistance. Learn about the implications of recent market volumes, institutional accumulation, and technical formations on DOGE's trajectory in Q4 2025. This detailed technical analysis serves traders seeking actionable insights into Dogecoin's bullish potential, highlighting vital trading levels and market conditions.
2025-11-05 01:37:49
What does on-chain data analysis reveal about Dogecoin's active addresses, whale movements, and transaction trends in 2026?

What does on-chain data analysis reveal about Dogecoin's active addresses, whale movements, and transaction trends in 2026?

This comprehensive analysis examines on-chain data metrics revealing Dogecoin's 2026 network dynamics through four critical dimensions. Daily active addresses approaching 60,000 demonstrate substantial institutional adoption and organic network growth beyond price speculation. Whale accumulation patterns show major holders concentrating 47.2 billion DOGE tokens, signaling strategic positioning and bullish reversal potential near $0.1415 resistance levels. Transaction volume surge to $1.55 billion reflects renewed market participation, with positive net inflows supporting recovery toward the $0.20-0.32 consolidation range. HODL wave analysis and Spent Coins Age Band data reveal long-term holder confidence despite near-term price consolidation below $0.16, indicating latent upside potential. Institutional participation through Gate and other platforms confirms sustained conviction in DOGE's directional momentum and market structure evolution.
2026-01-10 05:57:50
Recommended for You
What is the difference between competing cryptocurrencies: performance, market cap, and user adoption comparison

What is the difference between competing cryptocurrencies: performance, market cap, and user adoption comparison

This comprehensive guide compares competing cryptocurrencies across three critical dimensions: performance metrics, market valuation, and user adoption patterns. Performance analysis evaluates transaction speed, throughput, and energy efficiency, revealing how leading cryptocurrencies balance scalability trade-offs differently. Market capitalization trends highlight Bitcoin and Ethereum's dominance while showcasing emerging competitors like BNB's strategic positioning. User adoption indicators—including active addresses, transaction volume, and geographic distribution—differentiate genuine utility from speculative value. The article examines technological innovations, scalability solutions, and ecosystem integrations that drive competitive advantages on Gate and other platforms. Essential for investors, traders, and cryptocurrency enthusiasts seeking data-driven comparisons to identify which digital assets align with their investment objectives and real-world utility needs.
2026-01-22 01:17:48
What Are the Biggest Smart Contract Vulnerabilities and Crypto Exchange Hacks in 2024?

What Are the Biggest Smart Contract Vulnerabilities and Crypto Exchange Hacks in 2024?

This comprehensive guide examines the critical security landscape of cryptocurrency in 2024, highlighting over $14 billion in losses from smart contract vulnerabilities and $240 million stolen through exchange hacks. The article explores major vulnerability categories including reentrancy attacks, flash loan exploits, improper access controls, and logic errors that dominated the attack landscape. Beyond code exploits, it analyzes how centralized exchange custody risks threaten user funds through weak key management, infrastructure vulnerabilities, and insider threats. The guide addresses platform security gaps affecting Gate and other major exchanges, detailing breach vectors and protection mechanisms. Through detailed FAQ sections, readers learn to identify vulnerabilities, understand incident response procedures, and implement preventive security measures. This resource serves crypto investors, developers, and security professionals seeking to understand 2024's most damaging threats to digital assets and pr
2026-01-22 01:15:48
How to Use MACD, RSI, and Bollinger Bands to Trade Crypto Like a Pro

How to Use MACD, RSI, and Bollinger Bands to Trade Crypto Like a Pro

Master professional cryptocurrency trading by combining MACD, RSI, and Bollinger Bands into a unified technical framework. This comprehensive guide teaches traders how to identify overbought/oversold levels through multi-indicator confirmation, reducing false signals significantly. Learn golden cross and death cross strategies using 20/50/200-day moving averages for precise entry and exit timing on platforms like Gate. Discover volume-price divergence analysis to confirm genuine trend reversals and distinguish false breakouts from sustained moves. The guide covers parameter optimization across timeframes, common pitfalls in indicator usage, and professional risk management techniques. By synchronizing all three indicators with volume analysis, traders gain enhanced conviction for market reversals and achieve superior trading accuracy in volatile crypto markets.
2026-01-22 01:14:11
What do crypto derivatives market signals reveal about future price movements?

What do crypto derivatives market signals reveal about future price movements?

This article reveals how crypto derivatives market signals predict price movements through multiple analytical lenses. It examines futures open interest and funding rates as critical leverage indicators, explores long-short ratios and liquidation data for timing reversals, and analyzes options positioning to identify support and resistance levels. By studying these interconnected signals—including extreme positioning thresholds and whale accumulation patterns—traders can systematically anticipate market inflection points and price directional shifts. The comprehensive FAQ section addresses key prediction strategies, signal interpretation, and practical risk management approaches. Whether monitoring Gate or analyzing liquidation cascades, understanding these derivatives metrics transforms price prediction from speculation into data-driven analysis for both institutional and retail traders.
2026-01-22 01:12:16
What Is the Current Price of TapSwap Coin

What Is the Current Price of TapSwap Coin

This comprehensive guide explains the key factors determining TapSwap coin price movements, including market demand, sentiment, regulatory developments, and technological advancements. It addresses current pricing information challenges and recommends monitoring Gate and other major platforms for real-time data. The article explores long-term outlook factors such as adoption rates, ecosystem innovation, and market trends that influence TapSwap's valuation. Additionally, it provides practical guidance on safely buying, storing, and trading TapSwap coins through secure wallets and trusted exchanges. The FAQ section addresses common investor questions about current pricing, purchase methods, price trends, and future prospects. Perfect for both beginner and experienced crypto investors seeking informed decisions about TapSwap investment opportunities while managing associated risks effectively.
2026-01-22 01:11:17
What impact do SEC regulations and KYC/AML policies have on crypto compliance and market stability

What impact do SEC regulations and KYC/AML policies have on crypto compliance and market stability

This article examines how SEC regulatory frameworks and KYC/AML policies fundamentally reshape cryptocurrency market compliance and stability. Since 2024, SEC oversight has clarified that many digital assets function as securities, requiring exchanges to implement comprehensive registration, identity verification, and anti-money laundering protocols. Major platforms have successfully reduced illicit transactions by over 85% through these measures while attracting institutional investors who prioritize compliance assurance. The regulatory enforcement creates a positive feedback loop where clear guidelines on Gate and other platforms enhance market confidence, reduce volatility, and strengthen asset legitimacy. Audit transparency standards further build investor trust by demonstrating operational integrity and fund segregation. Collectively, these compliance mechanisms establish a mature, predictable market ecosystem that supports sustainable institutional adoption and long-term market resilience.
2026-01-22 01:10:25