Double Bottom Pattern in Trading
What Is It
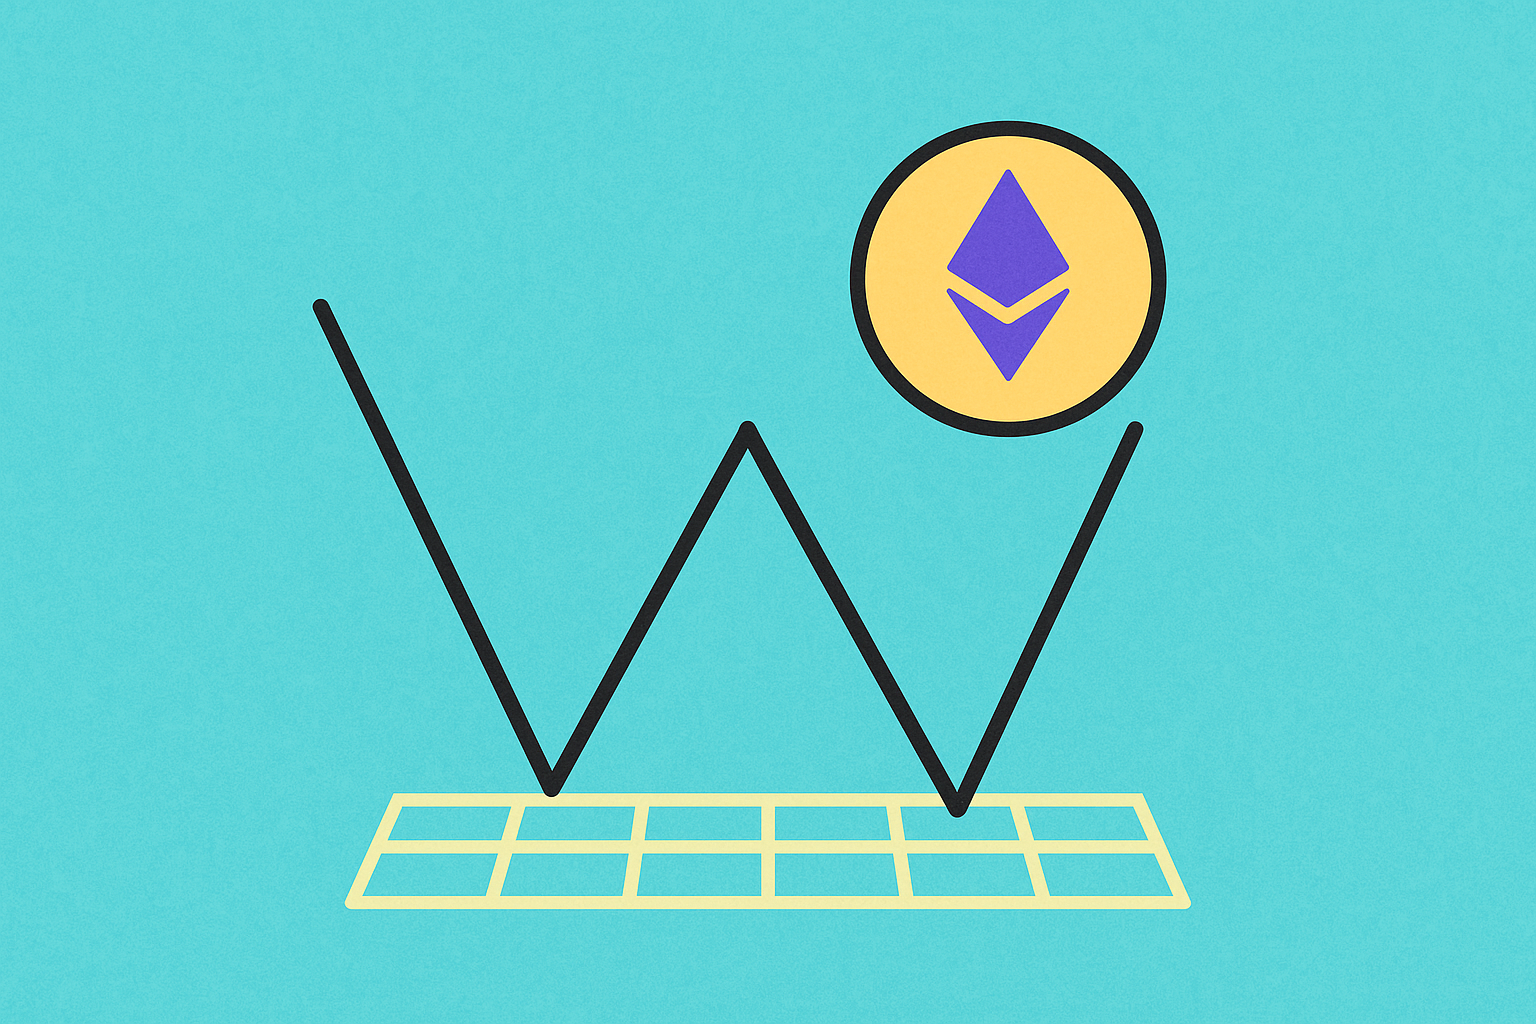
The double bottom is a major chart pattern in technical analysis, forming after a prolonged decline. This pattern features two local lows at nearly the same price level, separated by an intermediate high. Visually, it resembles the letter "W" and signals a potential reversal from a downtrend.
This formation is important because it indicates a possible market trend change, especially when it occurs alongside a significant increase in trading volume. The pattern’s structure is as follows:
● First bottom: Created by a sharp price drop to a key support line, followed by a rebound. For example, a token falling 50% from $300 to $150 forms the initial low.
● Intermediate peak: After the rebound, price recovers—say, to $195—then falls again. This peak marks a local high and sets the resistance line, which is critical for pattern confirmation.
● Second bottom: The price drops again, returning to the $150 area, creating the second low. The second bottom should be at roughly the same price as the first, with a maximum deviation of 3–5%.
● Pattern completion: Occurs when price breaks above the resistance line. If this breakout happens with increased volume, the pattern is complete—indicating a high probability of a trend reversal and a new uptrend.
The double bottom is the opposite of the double top, which forms an "M" shape and signals a reversal from an uptrend to a downtrend. In multi-bottom and multi-top patterns, the breakout level marking completion is called the neckline. For the double bottom, the neckline is the resistance line; for the double top, it’s the support line.
How to Identify
Recognizing a double bottom requires more than just spotting the "W" shape—it demands a deep grasp of market dynamics and context. Professional traders rely on multiple parameters and tools for reliable identification.
1. Chart Screening
Initial identification begins with a visual scan of the price chart:
● Look for the W-shaped formation as the first step in pattern recognition.
● Drawdown depth: Should range from 20% to 50% relative to the preceding trend, indicating a significant correction.
● Pattern duration: Typically lasts 4–16 weeks, but can vary across timeframes.
● Lows symmetry: The local lows should align almost horizontally, with up to 3–5% difference. The closer the lows, the more reliable the pattern.
● Correlation with related assets: This helps confirm the broader market trend and strengthens the pattern’s reliability.
2. Volume Dynamics
Trading volume analysis is vital for pattern validation:
● Overall activity level: The average trading volume should exceed previous weeks or months, indicating heightened market interest.
● Volume drop after the first bottom: Suggests decreased selling pressure and possible downtrend exhaustion.
● Lower activity at the intermediate high: Reflects buyer indecision and resistance zone formation.
● Sharp volume increase at the second bottom—especially on a resistance breakout—confirms buyer strength and intent to reverse the trend.
3. Confirmation via Oscillators
Technical indicators offer supporting evidence for the pattern:
● RSI (Relative Strength Index): Readings between 15 and 30 indicate oversold conditions, common when a bottom forms.
● MACD (Moving Average Convergence Divergence): Bullish divergence at the reversal point is a strong confirmation.
● Bollinger Bands: Price touching the lower band signals an extreme deviation from average values.
● Stochastic oscillator: The indicator rising above the lower zone (usually under 20) flags a potential reversal.
The more methods used to detect and confirm the pattern, the more robust the signal. Reliability also depends on the time between support line touches—the longer the interval, the stronger the signal. Sustained, unbroken support reflects significant buying strength, making further declines less likely unless there are strong external shocks.
For improved forecast accuracy, apply fundamental analysis, consider geopolitics, and assess mid-term trends for both the market and the asset. Key practical notes:
● Statistically, the pattern has a 65–80% probability of working—one of the most reliable technical analysis tools.
● It is not universal and must be adapted for each asset.
● Effectiveness requires ongoing validation with additional analysis tools.
● In highly volatile markets like crypto, performance can differ from classic expectations.
After the first bottom and upward movement, price often consolidates at the intermediate peak, reflecting market indecision about the next move. Demand is increasing, but not yet strong enough for a decisive resistance breakout.
Modern technology enables automatic detection of double bottoms, double tops, and other chart patterns using trading or algorithmic scalping apps. These tools are best suited for professionals, as high-quality solutions typically require substantial investment.
Example Pattern
To illustrate the double bottom’s practical use, consider a real example from the crypto market: Ethereum’s chart from June to August 2022, which showed a triple bottom—a variation with an extra low. This is sometimes called the "three rivers" pattern. The inverse at a market top is called "three mountains."
Detailed pattern development:
Initially, Ethereum dropped 45% from its average, with a false break below key support at $1,000—this was the first bottom. Price then climbed to $1,300, forming the first peak and resistance. After another decline and rally, the pattern completed with a third dip.
For weeks, ETH traded between support at $1,000 and resistance at $1,300. This consolidation built tension and set up a strong move. Eventually, ETH broke out above resistance.
After completion, the price surged from the $1,000 low to nearly $2,000—almost doubling. This marked the end of the triple bottom and a clear shift to an uptrend.
Trading volume analysis shows: at support, volume jumped versus previous periods. This may reflect long positions by institutions and retail, aggressive ETH accumulation by whales and regular buyers, and the psychological significance of the round $1,000 mark.
Still, market dynamics were mixed: alongside buying, some sold ETH—due to disappointment, loss realization, or portfolio rebalancing. Volume spiked at support but declined days after the first bottom.
Importantly, at the final resistance breakout, trading activity did not spike as expected—potentially misleading traders who rely only on volume analysis. This example highlights why a comprehensive approach—using multiple tools and understanding market narrative and fundamentals—is vital for accurate pattern assessment.
How to Use
Trading the double bottom pattern involves several strategic approaches, each with unique benefits and risks.
Classic entry strategy: The most common approach. Enter a long position on a clear resistance breakout, with pre-set take-profit and stop-loss levels. Risk management guidelines:
● Take-profit: Set at 50–100% above the bottom. If the low is $150, target $225–$300.
● Stop-loss: Place 3–5% below the second bottom to protect capital if the breakout fails and the downtrend resumes.
Aggressive strategy: Enter earlier—during or just after the second bottom forms. This can secure a better entry price but carries higher risk, as the pattern is unconfirmed and further declines are possible.
Conservative strategy: Wait for full trend reversal confirmation after the pattern completes. Enter after price not only breaks resistance but also holds above it, possibly after a brief retest. This reduces false signal risk but may sacrifice some potential profit.
Understand market dynamics post-pattern: after a double bottom and initial rise, a corrective move often follows, usually not reaching the old support. New uptrends take time to build momentum, so early growth may be moderate.
Using derivatives: If trading futures contracts, remember holding a position may incur funding rates, which can be positive or negative. Alternatively, margin trading with leverage avoids regular fees typical of perpetual futures.
Critical warning: The appearance of a double bottom—even with confirmation from multiple indicators—does not guarantee signal success. Factors that may negate the pattern:
First, analysis across different timeframes can deliver conflicting signals—identical price moves may be interpreted differently depending on the interval.
Second, global macro and geopolitical events—crises, migration issues, border tensions, political scandals, or financial shocks—can override technical signals and impact all markets.
Third, the asset’s fundamentals matter most: if the project behind a token faces development, funding, team, or product problems, growth prospects diminish regardless of technical patterns.
Consider this wisdom from Paul Tudor Jones, a legendary trader: “I believe the very best money is made at the market turns. Everyone says you get killed trying to pick tops and bottoms and that you make all your money by playing the trend in the middle. Well, for twelve years I have been missing the meat of the moves but I've caught a lot of tops and bottoms and made some money at it.”
Other Reversal Patterns
Beyond the double bottom, technical analysis includes many other chart patterns signaling possible trend reversals. The most significant are:
Head and Shoulders
The head and shoulders pattern is one of the most reliable and recognized reversal signals. It’s widely used by professionals and has high statistical validity.
The classic structure includes three consecutive price peaks:
● Left shoulder: Forms during an ongoing uptrend, marking a local high followed by a correction.
● Head: The central, highest peak—well above the left shoulder. This is the uptrend’s climax and the point of maximum market optimism.
● Right shoulder: Forms after the head’s decline, with a peak below the head but close to the left shoulder. Failure to make a new high signals weakening buying momentum.
● Support line (neckline): Drawn through the lows between peaks. This line is crucial for pattern confirmation.
The neckline is often sloped, not horizontal. Analysts note a downward-sloping neckline typically signals a more reliable bearish setup, reflecting weakening support.
The classic sequence is a neckline break after the right shoulder forms, usually with lower volume at the right shoulder than the left or head. After the breakout, a retest of the neckline often occurs before the main decline begins.
Bullish and Bearish Wedge
A bullish wedge is an ascending chart structure with a narrowing corridor between support and resistance. Despite its upward slope, it often precedes a bearish reversal.
The bullish wedge features converging, upward-sloping trendlines with different gradients. Key signs:
● Rising highs and lows, which can create the illusion of a continuing uptrend.
● Decreasing price swing amplitude, showing weakening momentum.
● Narrowing range, building market tension as the pattern progresses.
● Falling trading volume, confirming waning buyer enthusiasm.
Psychologically, the bullish wedge reflects growing tension and uncertainty—each new high is harder to achieve, swings shrink, and buyers lose steam. A breakdown below the pattern’s lower limit usually triggers a sharp decline.
A bearish wedge is the opposite: a descending structure with converging trendlines. Despite its downward angle, it often precedes a bullish reversal.
Bearish wedge traits mirror the bullish wedge: lower highs and lows, shrinking swings, narrowing range, and declining volume. A break above the pattern’s upper limit signals a new uptrend.
Ascending and Descending Triangle
The ascending triangle is a consolidation pattern, usually in an uptrend, and is generally seen as a bullish continuation signal, though in some cases it marks a reversal.
Key features:
● Horizontal resistance line at a fixed price, where sellers defend their positions.
● Rising support line moving upward, showing higher lows.
● Gradual build-up of buying pressure as price approaches resistance.
● Breakout potential increases with each test of resistance as sellers are exhausted.
This pattern reflects buyers’ willingness to pay higher prices as sellers hold the line. Typically, the struggle ends with a breakout and uptrend continuation.
A descending triangle is the opposite: a horizontal support line and descending resistance. It’s a classic bearish pattern, usually preceding a continued downtrend.
Here, buyers defend support, but sellers become more aggressive, producing a series of lower highs. Breaking support typically triggers a sharp decline as the final buyer defense falls.
Conclusion
Financial market traders often see clear reversal signs, but in reality, reversals do not always play out as expected. These gaps between technical signals and actual market behavior have objective causes.
The main point: recognizing technical patterns like the double bottom is not enough for sound trading decisions. Success requires considering a broad range of factors—asset fundamentals, macroeconomic trends, geopolitics, market sentiment, volume, and much more.
The double bottom and other chart patterns are only components of a complex analytical process. They offer valuable insight on potential reversal points and optimal entries, but are most effective when used with other analysis methods.
Professional traders know that technical analysis is about probabilities, not certainties. No pattern guarantees a particular result. Disciplined risk management, stop-losses, diversification, and continual learning are the pillars of successful trading.
Remember, markets evolve, and patterns that worked in the past may lose their edge as more participants use them. Critical thinking, adaptability, and integrating diverse information sources are essential for today’s trader.
FAQ
What is a double bottom and what is its significance in technical analysis?
A double bottom is a technical analysis pattern formed by two local lows at nearly the same level. It signals a reversal from bearish to bullish. For traders, it’s a key buy signal and a support level. A breakout above resistance between the lows confirms the bullish move.
How do you accurately identify a double bottom? What conditions must be met?
A double bottom forms with two consecutive drops to about the same support level, separated by a rally. Requirements: price hits the low twice, the midpoint is higher than both bottoms, and trading volume rises on the second touch. This points to a potential uptrend.
What is the double bottom trading strategy? How do you set entry and stop-loss points?
The double bottom forms after two declines to the same support level. Enter after price breaks above resistance between the lows. Place a stop-loss below support. The profit target is typically the pattern’s height from the entry. Confirm with increasing trading volume.
How does a double bottom differ from other bottoms?
A double bottom has two support points at almost the same level, a triple bottom has three, and a V-bottom is a sharp drop followed by a rally. The double bottom signals a trend change after two lows with resistance in between.
What’s the success rate for the double bottom, and what is the typical risk/reward ratio?
Double bottoms succeed about 60–70% of the time when confirmed by volume. Risk/reward is typically 1:2 or 1:3, with potential gains much larger than the risk.
How do you use the double bottom in practical trading?
The double bottom signals a trend reversal. When price touches support twice and recovers, it confirms buyer strength. Enter long on a breakout above resistance with rising volume. Place a stop-loss below support.
Does the double bottom appear the same on all timeframes?
The double bottom differs by timeframe: On lower timeframes (4h, 1h), it forms faster and with less volume; on higher (daily, weekly), it’s more reliable and significant. On a monthly chart, it can predict strong growth, while on an hourly chart it may be a false signal.

How to Use Technical Indicators (MACD, RSI, KDJ) for Crypto Trading Signals?
How to Use MACD, RSI, and Bollinger Bands for Crypto Trading Signals in 2025

How to Use MACD, RSI, and Bollinger Bands Indicators for Crypto Trading in 2026?

# How to Use Technical Indicators (MACD, RSI, KDJ, Bollinger Bands) for Crypto Trading Analysis

How to Use MACD, RSI, and Bollinger Bands for Crypto Trading Signals in 2026

How to Use MACD, RSI, and Bollinger Bands for Crypto Trading Signals in 2026

Comprehensive guide to increasing your savings

What Does 1e18 Mean in Cryptocurrency?
How to Burn Tokens on Solana?

What CPU and GPU for Bitcoin Mining: A Comprehensive Guide

Rocky Rabbit SuperSet Combo and Enigma Puzzle Solutions: Daily Challenges Guide