fomox
MarketsPerpsSpotSwap
Meme
Referral
More
Become a Smart Money on Tracker
Search Token/Wallet
/

How Do Exchange Net Flows and Holding Concentration Affect LAVA Price Movement in 2025?

2026-01-13 02:37:37
Altcoins
Crypto Insights
Crypto Trading
Cryptocurrency market
Futures Trading
Article Rating : 4.5
half-star
128 ratings
This comprehensive guide examines the critical factors driving LAVA price movements in 2025 through on-chain metrics and market structure analysis. It explores how exchange net flows at $351K daily volume signal distribution or accumulation phases, affecting volatility patterns. The analysis reveals LAVA's vulnerability to whale trading due to thin liquidity and high holding concentration—with top five addresses controlling 66% of tokens. Additionally, open interest trends serve as leading indicators for price direction, with LAVA's 246% December surge demonstrating elevated market participation. By monitoring exchange net flows, holding concentration, and derivative activity through Gate trading data, investors gain actionable insights for predicting LAVA price trajectories throughout 2025.
How Do Exchange Net Flows and Holding Concentration Affect LAVA Price Movement in 2025?

Exchange Net Flows: How $351K Daily Trading Volume Influences LAVA Price Volatility

Exchange net flows represent the continuous movement of LAVA tokens flowing into and out of trading platforms, serving as a critical barometer for understanding market dynamics and price behavior. At the $351K daily trading volume level that LAVA typically experiences, these flows become particularly significant in driving price volatility. When substantial inflows occur—with large quantities of LAVA deposited onto exchanges—it frequently signals imminent selling pressure, as holders prepare to liquidate positions, often resulting in downward price movement due to increased liquidity and supply.

Conversely, high outflows present a distinctly different narrative for LAVA price development. When investors withdraw their tokens from exchanges in volume, it reduces available trading liquidity and typically indicates accumulation behavior, suggesting holders are securing assets for long-term strategies rather than immediate sales. This reduced liquidity from outflows often correlates with upward price pressure, as fewer tokens remain available for trading.

The relationship between net flows and volatility at LAVA's $351K volume level demonstrates how trader behavior directly influences price swings. During periods of volatile inflows and outflows, the order book experiences significant shifts, magnifying price movements in both directions. Monitoring these net flow patterns provides traders with valuable insights into whether LAVA is experiencing distribution phases—when inflows dominate—or accumulation phases—when outflows prevail—allowing for more informed strategic positioning based on underlying capital flow dynamics.

Holding Concentration Risk: Low Liquidity Tokens Susceptible to Whale Trading Impact

LAVA's position as a low-liquidity token creates significant vulnerability to whale trading activities that can trigger substantial price volatility. With a 24-hour trading volume of approximately $1 million against a market capitalization exceeding $85 million, the token's thin liquidity profile means large buy or sell orders can disproportionately move prices. Whale accumulation becomes particularly impactful in such environments, as concentrated holdings by major traders can execute substantial transactions that rapidly shift market sentiment and trigger cascading price movements.

The mechanism underlying this risk stems from how leverage and deleveraging cycles interact with holding concentration. When whales accumulate LAVA, they effectively reduce available liquidity, making the token more susceptible to price swings during periods of market stress. During deleveraging events, exchange risk control systems indiscriminately liquidate collateral across various assets, meaning whale-influenced low-liquidity tokens experience amplified selling pressure regardless of their fundamental strength. This structural vulnerability means LAVA's price can experience dramatic fluctuations of 20-30% or more on relatively modest trading volumes, particularly when whale positions shift or systemic leverage unwinds. The early capital concentration already present in LAVA amplifies these dynamics, creating an environment where holding concentration represents a critical risk factor influencing near-term price trajectories throughout 2025.

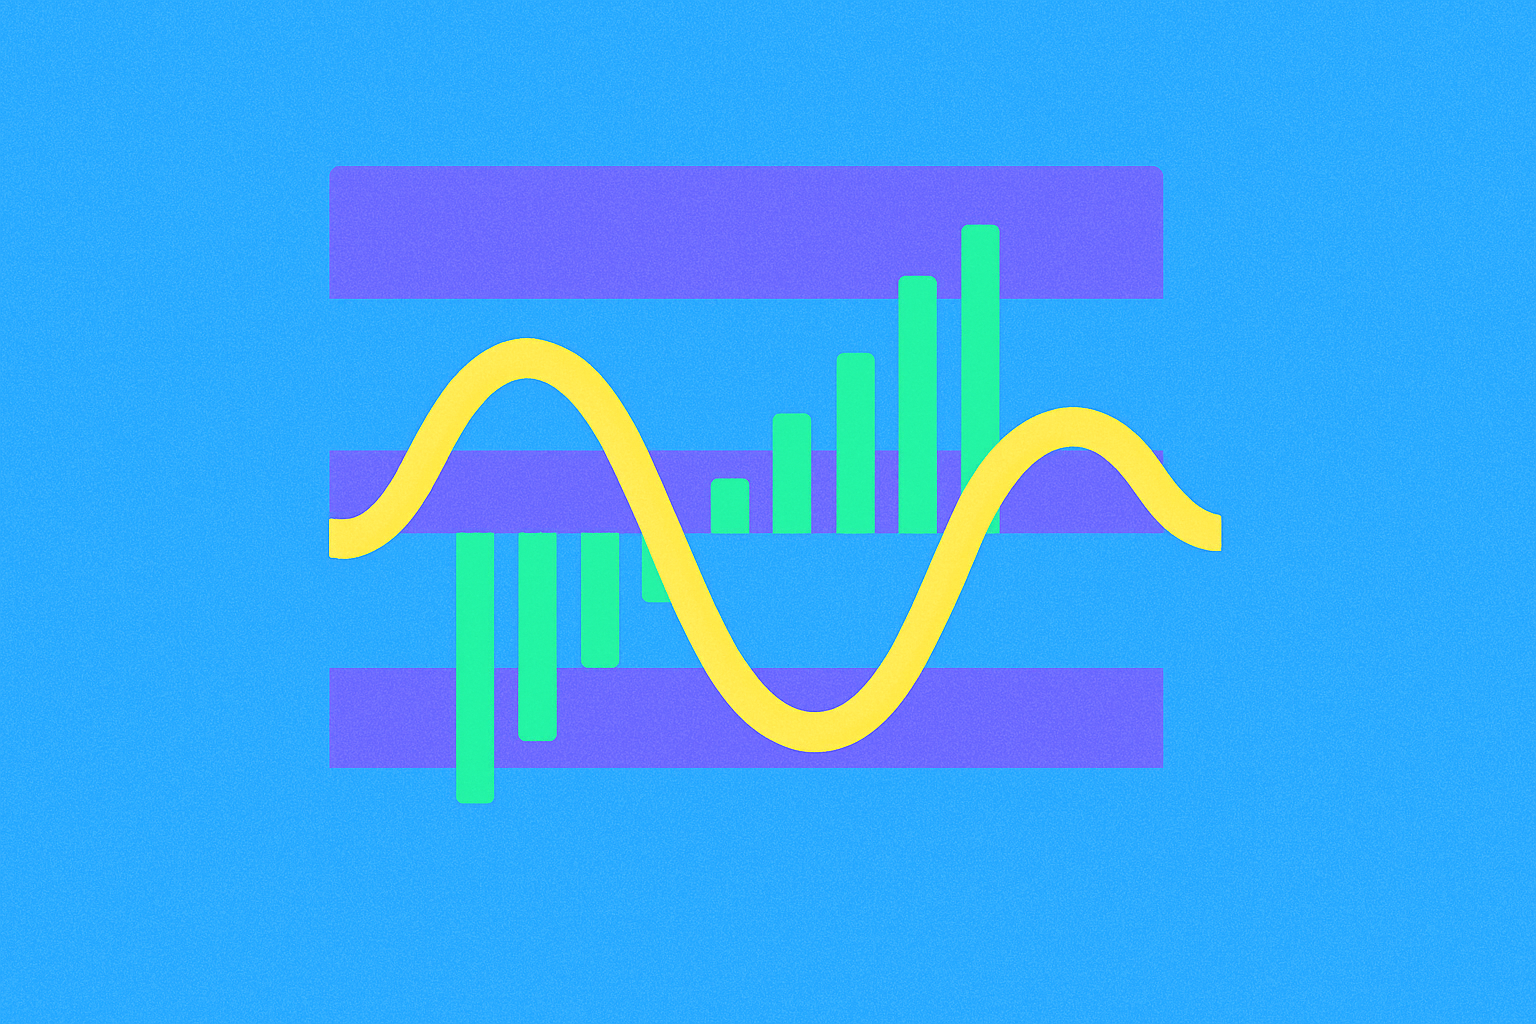
Open interest represents the total number of outstanding derivative contracts on a specific asset, serving as a critical barometer for market participation intensity. Throughout 2025, cryptocurrency derivatives markets experienced substantial growth, with average daily open interest reaching $31.3 billion and peaking at $39 billion during mid-September. This expansion reflects increasing institutional participation, particularly following CME's expanded crypto offerings alongside traditional exchange platforms.

For LAVA price forecasting, open interest trends function as a leading indicator of potential price movements. When open interest rises sharply alongside price increases, it typically signals strengthening conviction among market participants, suggesting sustainable momentum. Conversely, declining open interest during price rallies often precedes reversals, indicating weakening commitment. During December 2025, LAVA experienced a dramatic 246% price surge from $0.08 to $0.26, accompanied by elevated trading volumes exceeding $9 million daily—metrics reflecting heightened market participation and derivative activity.

Quantitative models integrate open interest data with machine learning algorithms to enhance price forecasting accuracy. By analyzing the relationship between open interest changes and historical price patterns, analysts can identify regime shifts in market dynamics. This market participation metric proves particularly valuable when combined with funding rates and active participant counts, creating a comprehensive picture of market health and directional bias for LAVA valuations.

FAQ

What is LAVA token? What are its main use cases and value propositions?

LAVA token is a blockchain-based utility token designed for transaction fee payments and platform governance participation. Its value proposition focuses on enhancing user experience, enabling efficient network operations, and providing holders with governance rights within the ecosystem.

How do exchange net flows affect LAVA price movement?

Positive exchange net flows indicate selling pressure, potentially pushing LAVA prices down. Negative flows suggest accumulation, supporting upward price momentum. Large flow concentrations amplify volatility and directional moves significantly in 2025.

How does holding concentration affect LAVA price movement?

High holding concentration increases price volatility and manipulation risk. When large holders control significant portions, sudden selling causes sharp declines, while accumulation drives sharp rallies. Lower concentration suggests more stable, organic price discovery and reduces extreme fluctuations.

Monitor exchange net flows, holding concentration, and transaction volume metrics. Rising adoption and network expansion drive price movement. On-chain indicators suggest LAVA could reach $0.215 in 2025, supported by cross-chain interoperability advantages and positive market fundamentals.

High holder concentration in LAVA means what risks for investors?

High concentration increases price volatility risk. If major holders sell simultaneously, it could trigger sharp price declines. This creates liquidity concerns and reduces market stability, making LAVA more susceptible to sudden price swings and potential manipulation.

Does increased exchange inflow usually indicate that LAVA price will decline?

Increased exchange inflow does not necessarily predict LAVA price decline. Price movements are influenced by multiple factors including market demand, supply dynamics, and broader market sentiment. Historical inflow data alone is not a reliable predictor of future price trends.

Who are the main LAVA token holders? How much impact do whale address activities have on price movements?

The top five addresses control approximately 66% of LAVA tokens, creating high concentration. Whale transactions significantly influence price volatility. This concentrated holding structure increases market fluctuation risk and price sensitivity to large transfers.

What are the technical and fundamental prospects of LAVA in 2025?

LAVA Network shows bullish long-term potential with projected prices between $0.1244-$0.177 in 2025. Key growth drivers include institutional adoption, regulatory developments, and protocol upgrades. Current bearish RSI suggests oversold conditions, presenting potential buying opportunities for investors confident in LAVA's ecosystem expansion.

How to monitor and analyze LAVA exchange net flows and holding concentration data?

Use blockchain analysis tools to track active addresses and transaction volumes. Top five addresses control approximately 66% of LAVA tokens, indicating high whale concentration affecting market dynamics and price stability.

How does LAVA compare to similar tokens in terms of liquidity and holding concentration?

LAVA demonstrates moderate liquidity with low centralization compared to peer tokens. It features active strategic partnerships and a focused developer community. The LAVA SDK enables decentralized access across multiple blockchains, supporting growing ecosystem adoption and reducing token concentration risks through distributed network participation.

* The information is not intended to be and does not constitute financial advice or any other recommendation of any sort offered or endorsed by Gate.

Share

Content

Exchange Net Flows: How $351K Daily Trading Volume Influences LAVA Price Volatility

Holding Concentration Risk: Low Liquidity Tokens Susceptible to Whale Trading Impact

FAQ

Related Articles
What is JELLYJELLY holding and fund flow: exchange inflows, concentration, staking rate, and on-chain lockup

What is JELLYJELLY holding and fund flow: exchange inflows, concentration, staking rate, and on-chain lockup

The article examines the risks and market dynamics of JELLYJELLY tokens, focusing on concentration risk, exchange inflows, and the impact of perpetual futures. It highlights how top holders' control of 74.84% of the supply poses significant volatility threats due to whale manipulation. Additionally, it discusses the strong retail participation in digital assets during 2025, surpassing traditional gold investments, and warns about potential market overheating signaled by high open interest and negative funding rates. This comprehensive analysis is crucial for investors navigating the volatile JELLYJELLY market.
2025-12-20 03:44:21
What are crypto derivatives market signals and how do futures open interest, funding rates, and liquidation data impact trading in 2026?

What are crypto derivatives market signals and how do futures open interest, funding rates, and liquidation data impact trading in 2026?

# Article Introduction **Crypto Derivatives Market Signals: Mastering Futures, Funding Rates & Liquidation Data in 2026** This comprehensive guide decodes critical derivatives market signals that drive crypto trading in 2026, including futures open interest exceeding $500 billion, funding rate dynamics, and liquidation cascades. Learn how leverage multipliers create price pressure, how positive funding rates signal both bullish sentiment and liquidation risks, and why tracking forced closures predicts market reversals. By analyzing long-short ratios, options positioning, and on-chain liquidation patterns across major platforms like Gate, traders gain actionable insights for risk management and strategic positioning. This resource equips derivatives traders, risk managers, and institutional investors with data-driven frameworks to distinguish genuine market conviction from fragile sentiment, optimize entry-exit timing, and navigate 2026's volatile derivatives landscape effectively.
2026-01-01 02:30:22
What Are Crypto Derivatives Market Signals: How to Read Futures Open Interest, Funding Rates, and Liquidation Data in 2025

What Are Crypto Derivatives Market Signals: How to Read Futures Open Interest, Funding Rates, and Liquidation Data in 2025

# Article Introduction Master crypto derivatives market signals to navigate 2025's volatile landscape. This comprehensive guide decodes futures open interest, funding rates, long-short ratios, and liquidation data—essential metrics for predicting price movements and managing risk. Learn how to interpret 65%+ liquidation cascades, identify extreme positioning through funding rate spikes, and spot early warning signals before major corrections. Whether trading on Gate or analyzing cross-exchange dynamics, discover actionable strategies for reading market sentiment through derivatives indicators. Designed for traders seeking data-driven decision-making and precise risk management in leveraged crypto markets.
2025-12-27 03:17:41
What Are Derivatives Market Signals: How to Read Futures Open Interest, Funding Rates, and Liquidation Data in Crypto Trading?

What Are Derivatives Market Signals: How to Read Futures Open Interest, Funding Rates, and Liquidation Data in Crypto Trading?

This article delves into the critical components of crypto trading through derivatives market signals, focusing on futures open interest, funding rates, and liquidation data. It helps traders understand institutional positioning, leverage effects, and market sentiment, offering insights into potential price movements. Readers will learn how to analyze derivatives data for strategic trading opportunities, identifying key support and resistance zones through liquidation heatmaps and options open interest. This content is tailored for traders seeking actionable intelligence in crypto markets, improving decision-making by leveraging derivatives insights. Key terms like "futures open interest," "funding rates," and "liquidation" boost keyword density for enhanced readability.
2025-12-22 01:51:01
How Do Futures Open Interest, Funding Rates, and Liquidation Data Signal Crypto Derivatives Market Trends?

How Do Futures Open Interest, Funding Rates, and Liquidation Data Signal Crypto Derivatives Market Trends?

The article examines how futures open interest, funding rates, and liquidation data signal trends in the crypto derivatives market, focusing on HBAR. It highlights a significant surge in futures open interest and institutional participation, suggesting potential bullish reversals. It analyzes funding rates and long-short dynamics to reveal market sentiment. Liquidation events expose price discovery fragility, while options open interest indicates institutional hedging strategies. The content is tailored for traders and analysts seeking to interpret crypto derivatives data for strategic decision-making. Key terms such as "HBAR," "open interest," and "funding rates" enhance keyword density for optimal SEO.
2025-12-24 03:38:56
What Are Derivatives Market Signals? How to Read Futures Open Interest, Funding Rates, and Liquidation Data in Crypto

What Are Derivatives Market Signals? How to Read Futures Open Interest, Funding Rates, and Liquidation Data in Crypto

The article explores how to interpret derivatives market signals in crypto by analyzing futures open interest, funding rates, and liquidation data. It delves into the significance of open interest as a market participation metric, funding rates as sentiment indicators, and the role of liquidation cascades in institutional manipulation. Key topics include identifying market trends, understanding leverage extremes, and revealing crucial support levels. Targeted at traders and analysts, the content offers insights into strategic positioning and market behavior prediction, enhancing decision-making capabilities in crypto investing.
2025-12-22 01:49:20
Recommended for You
How to Use MACD, RSI, and KDJ Technical Indicators for Crypto Trading: A Complete Guide

How to Use MACD, RSI, and KDJ Technical Indicators for Crypto Trading: A Complete Guide

This comprehensive guide equips crypto traders with advanced techniques for using MACD, RSI, and KDJ technical indicators effectively. Master MACD DIF/DEA crossovers and zero-line dynamics to identify reliable entry and exit points, reducing false signals through price action confirmation. Learn to detect overbought/oversold conditions using RSI (70-80 thresholds) and KDJ %K values, recognizing trend reversals when K exceeds 50. Discover how MACD histogram analysis validates breakout authenticity by detecting volume-price divergence patterns. The guide covers optimal parameter settings, golden cross strategies, and multi-indicator combination approaches specifically for volatile crypto markets on Gate. Perfect for traders seeking to improve accuracy by filtering low-probability trades through objective momentum confirmation and avoiding common pitfalls when relying solely on single indicators.
2026-01-13 04:07:06
How do futures open interest, funding rates, and liquidation data signal crypto derivatives market trends?

How do futures open interest, funding rates, and liquidation data signal crypto derivatives market trends?

This comprehensive guide decodes how futures open interest, funding rates, and liquidation data reveal critical crypto derivatives market trends. ApeCoin's 29% surge in open interest to $78.9M demonstrates accelerating market participation and deepening liquidity expansion. Funding rates function as sentiment barometers, with positive rates signaling bullish optimization and negative rates indicating bearish hedging strategies, particularly among institutional investors using derivatives for risk management. Liquidation clustering at specific price levels identifies reversal points, while extreme long-short ratio imbalances concentrate risk and predict sharp price movements. The explosive growth in options open interest exceeding $39B introduces second-order derivatives complexity, creating nested risk dependencies across market layers. By integrating these three metrics—monitoring elevated open interest combined with extreme funding rates and concentrated liquidation zones—traders can identify market inflect
2026-01-13 04:05:21
How to Get a Verification Code from an Old Number

How to Get a Verification Code from an Old Number

This comprehensive guide addresses how to retrieve verification codes when your old phone number is no longer accessible, a critical concern for cryptocurrency users. The article explains why verification codes matter for account security, explores common scenarios causing access problems, and provides multiple recovery solutions including email verification, authenticator apps, and customer support assistance. It emphasizes establishing backup authentication methods on platforms like Gate, maintaining updated account information, and implementing preventive security practices. The guide offers practical steps for account recovery while maintaining security standards, including documentation requirements and alternative verification channels. Readers will gain actionable strategies to regain account access and prevent future lockout situations while protecting their digital assets.
2026-01-13 04:03:31
What is token economy model: token distribution, inflation mechanisms, and governance utility explained

What is token economy model: token distribution, inflation mechanisms, and governance utility explained

This comprehensive guide explains token economy models through three interconnected pillars: token distribution architecture, inflation mechanisms, and governance utility. Learn how projects like ApeCoin implement balanced allocation strategies—47% DAO treasury, 15% NFT airdrops, 38% contributor rewards—to align stakeholders and prevent power concentration. Discover why fixed supply caps with no token burn designs create scarcity and predictability. Explore governance utility where APE token holders participate in DAO decisions through proportional voting rights and earn staking rewards. The article addresses critical tokenomics questions including distribution methods, inflation prevention, vesting periods, and sustainability evaluation. Understanding these mechanisms on platforms like Gate helps investors and community members recognize sustainable token economies versus poorly designed models that risk market failure.
2026-01-13 04:03:22
How Active is ELIZA Community and What Drives Its Ecosystem Growth in 2025?

How Active is ELIZA Community and What Drives Its Ecosystem Growth in 2025?

ELIZA emerges as the dominant AI agent framework with 6,000+ GitHub stars and commanding 60% market share, driven by robust community engagement and developer adoption. The ecosystem demonstrates exceptional growth through strategically designed contributor programs, intensive hackathons, and grant initiatives that convert individual developers into committed stakeholders. ELIZA's extensible architecture supports 200+ crypto-native plugins and 60+ applications spanning DeFi automation, onchain games, and DAO tooling. Cross-platform integration enables autonomous agents across Solana, Base, and Ethereum, establishing a trustworthy execution environment for complex interactions. Institutional partnerships with Stanford and Chainlink reinforce platform credibility. Looking ahead, an open-core licensing model combined with revenue diversification through professional services, Eliza Cloud subscriptions, and marketplace fees positions ELIZA for sustainable long-term growth, balancing open-source principles with co
2026-01-13 04:01:34
How Can On-Chain Data Analysis Using Machine Learning Models Provide Real-Time Crypto Market Insights?

How Can On-Chain Data Analysis Using Machine Learning Models Provide Real-Time Crypto Market Insights?

This article explores how machine learning models revolutionize cryptocurrency market analysis through on-chain data interpretation. It covers four critical applications: real-time analysis of active addresses and transaction volume patterns; whale behavior tracking for sentiment signals; predictive insights on network fees using ElizaOS framework; and automated trading decisions via AI-driven intelligence. The framework enables traders to process thousands of blockchain data points simultaneously, identifying market opportunities faster than traditional analysis. Individual investors and trading platforms leverage these ML-powered insights to detect anomalies, optimize strategies, and execute transactions across Gate and multiple blockchain networks. The article addresses common questions about implementation, accuracy evaluation, and practical applications for informed decision-making in volatile crypto markets.
2026-01-13 03:59:48