How does Solana compare to Ethereum and Bitcoin in market cap, TVL, and transaction volume?
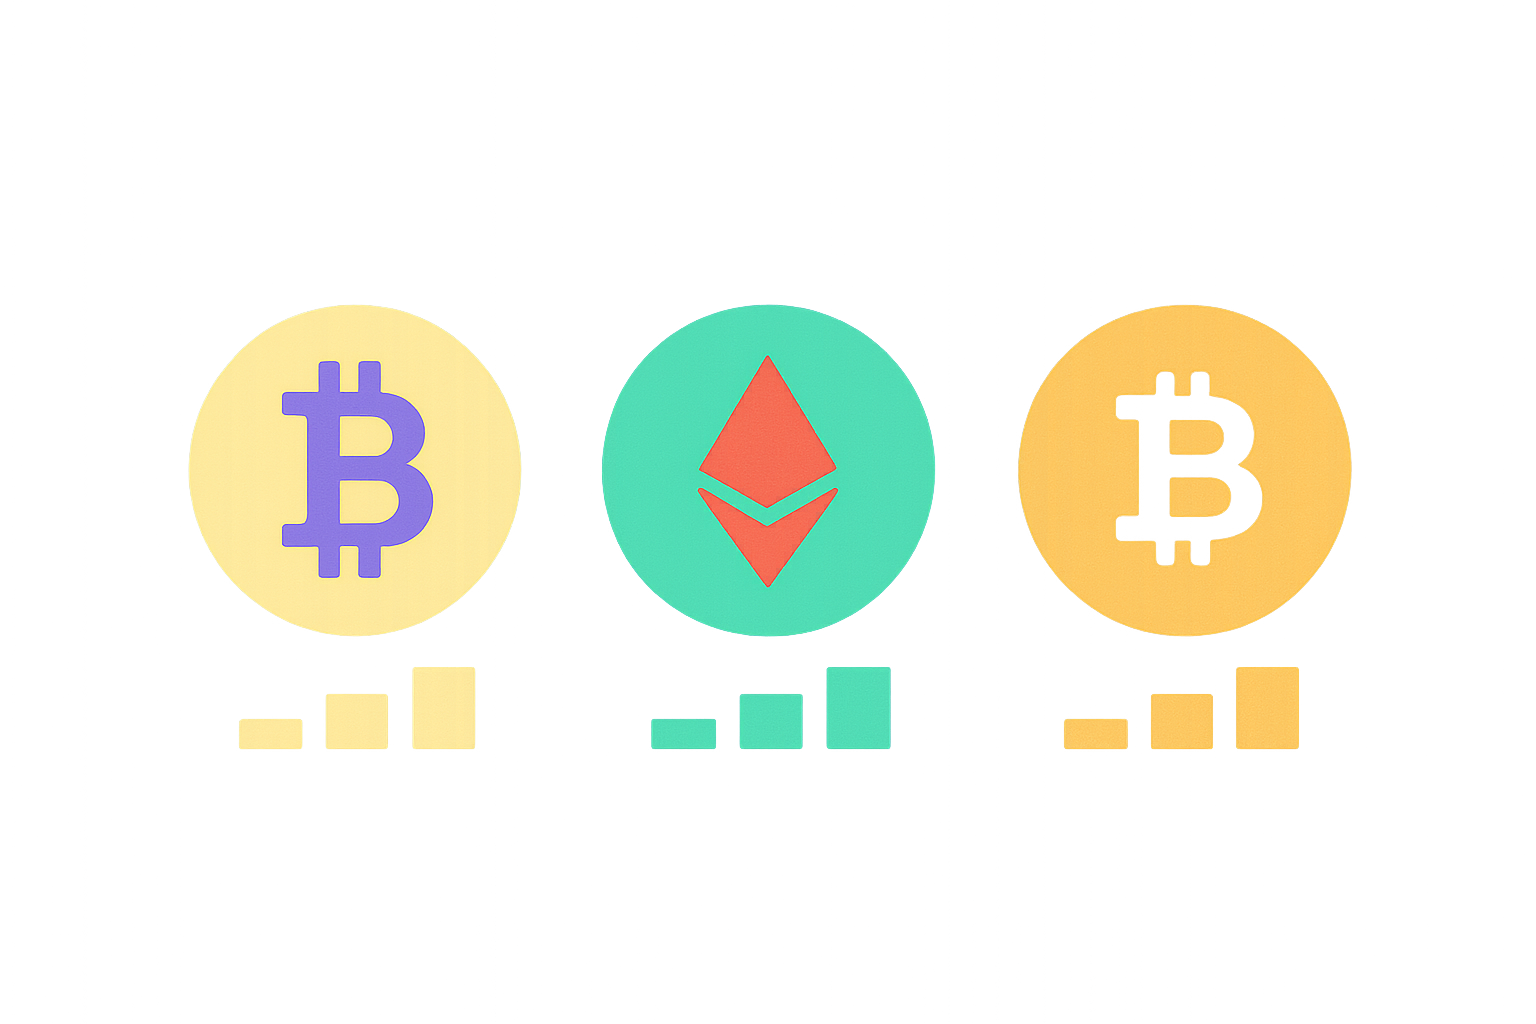
Market Capitalization Dominance: Bitcoin Leads with 28.1% YTD Returns While Ethereum and Solana Compete for Second Position
Bitcoin's commanding position in the cryptocurrency market reflects both sustained investor confidence and technical strength throughout 2025. With a market capitalization of $2.37 trillion, Bitcoin maintains approximately 59.25% dominance across the entire crypto ecosystem, translating to the 28.1% year-to-date returns that have solidified its status as the undisputed market leader. Trading at $88,118.52, Bitcoin's performance underscores the significant capital flowing toward the largest digital asset.
The competition for second position between Ethereum and Solana reveals fascinating divergence in value proposition. Ethereum commands $368.08 billion in market capitalization, leveraging its established infrastructure and security credentials as the leading smart contract platform. However, Solana's market cap of $69.12 billion, while substantially smaller, represents the performance-focused challenger gaining ground through cost efficiency and transaction speed advantages. The gap demonstrates that market capitalization dominance reflects not just adoption, but also investor sentiment toward blockchain characteristics. Ethereum's Layer 2 solutions and decentralized validator network of 700,000+ nodes maintain its second-rank positioning, yet Solana's 65,000+ transaction-per-second capacity and sub-cent transaction fees continue attracting users seeking scalability over established infrastructure. This dynamic shapes how investors evaluate these assets beyond raw market cap figures.
TVL and Transaction Efficiency: Ethereum Controls 63% of DeFi Liquidity but Solana Surpasses in NFT Volume and Lower Fees
Ethereum's dominance in DeFi liquidity remains unshaken, commanding approximately 63% of total locked value across decentralized finance protocols, with TVL fluctuating between $60–166 billion. This leadership reflects institutional trust and the maturity of Ethereum's ecosystem, anchored by extensive Layer 2 solutions like Arbitrum and Optimism that have helped reduce transaction friction. Meanwhile, Solana has rapidly expanded its DeFi footprint, achieving $35 billion in TVL by 2025, demonstrating substantial growth from just $3 billion two years prior.
The critical divergence emerges in transaction efficiency and cost economics. Solana processes over 1,000 transactions per second with median fees under $0.01, while Ethereum's base layer incurs $5–50 per transaction despite Layer 2 improvements reducing costs to $0.10–$1.00. This 20,000x fee advantage positions Solana as the preferred network for high-volume, cost-sensitive applications. Beyond DeFi, Solana significantly surpasses Ethereum in NFT transaction volume and daily active trading, driven by its superior throughput and frictionless user experience. Stablecoins dominate Solana's TVL at 43%, highlighting its role as a settlement layer for payments rather than complex DeFi strategies.
Market Share Evolution: Solana's Rising User Adoption Threatens Ethereum's DeFi Dominance in High-Throughput Applications
Ethereum's historical dominance in decentralized finance faces unprecedented pressure from emerging networks optimized for speed and cost efficiency. Solana's aggressive expansion in high-throughput applications has fundamentally shifted market dynamics, capturing 43% of global DEX volume and processing 81% of blockchain DEX transactions in 2025. This represents a significant encroachment on territories traditionally controlled by Ethereum, which historically commanded substantial transaction flow through its extensive DeFi ecosystem.
The performance differential drives user migration patterns toward Solana's architecture. With 3.25 million daily active users and approximately 70 million daily transactions, Solana demonstrates the appeal of networks delivering 4,000 transactions per second compared to Ethereum's approximate 30 TPS. Lower transaction costs, measured in fractions of a cent on Solana versus dollars on Ethereum, create compelling economics for retail and high-frequency trading operations. Solana added 11,534 developers in the first nine months of 2025, signaling accelerating builder momentum alongside existing institutional participation.
| Metric | Solana | Ethereum |
|---|---|---|
| DEX Volume Share | 43% | 87% |
| Daily Active Users | 3.25M | Higher TVL base |
| TPS Capacity | 4,000 | ~30 |
| RWA Market Growth (H1 2025) | +150% ($418M) | Established base |
Ethereum maintains structural advantages through superior TVL concentration (60% of total), deeper liquidity pools, and institutional relationships developed over years. However, high-throughput application developers increasingly view Solana as the preferred infrastructure for scaling user-facing products. This bifurcation reflects market specialization rather than complete displacement, yet clearly signals Ethereum's vulnerability in performance-sensitive segments.
FAQ
Which crypto has the highest TVL?
Ethereum has the highest total value locked (TVL) in the crypto space, significantly ahead of other blockchains. As of December 2025, Ethereum maintains its dominant position with the largest concentration of decentralized finance activity and liquidity.
How does Solana compare to Ethereum?
Solana offers higher transaction speeds and lower fees than Ethereum, making it ideal for real-time applications. Ethereum provides superior security and more established infrastructure, better for high-value transactions. The choice depends on prioritizing speed and cost versus security and reliability.
Why is Sol outperforming ETH?
Solana outperforms Ethereum through superior speed and lower transaction costs. Its high-throughput architecture enables faster settlement and greater scalability, making it more attractive for users and developers seeking efficiency.
What is the TVL ratio in crypto?
TVL ratio is calculated as market cap divided by total value locked (TVL). It measures a protocol's valuation relative to its locked capital. A lower ratio suggests better value, indicating the protocol is undervalued compared to its on-chain activity and user demand.
FAQ
What is Sol coin?
Sol Coin is the native cryptocurrency of the Solana blockchain, used for transaction fees and staking. Solana is a high-speed computing platform capable of processing around 50,000 transactions per second, combining proof of stake and proof of history mechanisms for decentralized validation.
Is Sol Coin a good investment?
Sol Coin presents strong investment potential with its advanced blockchain technology and growing ecosystem. Analysts project price appreciation to $150-$250 range driven by DeFi expansion and scalability improvements. Strong fundamentals make it attractive for crypto investors.
Can Sol reach $1000 USD?
Yes, SOL can potentially reach $1,000 USD with sustained network growth, increased adoption, and favorable market conditions. While requiring significant expansion, Solana's ecosystem strength and development trajectory make this target achievable over the long term.
What will Sol be worth in 5 years?
Based on long-term market trends and forecasts, Solana (SOL) is projected to reach approximately $1,200 by 2030. However, actual prices may vary depending on market conditions and adoption rates.
How does competitive analysis between Bitcoin, Ethereum, and Solana drive market share changes in 2025

How Does Solana (SOL) Compare to Ethereum and Bitcoin in 2025?

How to Conduct a Competitive Analysis for Crypto Projects in 2025?
How Does Ethereum Compare to Polygon and Solana in the DeFi and NFT Space?

How Does the Crypto Market Overview Look in November 2025?
Guide to Integrating Bitcoin with Your Web3 Wallet

What is token economics model and how does distribution, inflation, and governance mechanisms work?
How are DCR (Decred) holdings distributed across exchanges and what do capital flows reveal about investor sentiment?
How Active Is APE Coin Community and What DApps Drive Its Ecosystem Growth in 2026?

What are the compliance and regulatory risks facing ApeCoin (APE) in 2026?

How to Use Crypto Derivatives Market Signals to Predict 2026 Price Movements: Futures Open Interest, Funding Rates, and Liquidation Data