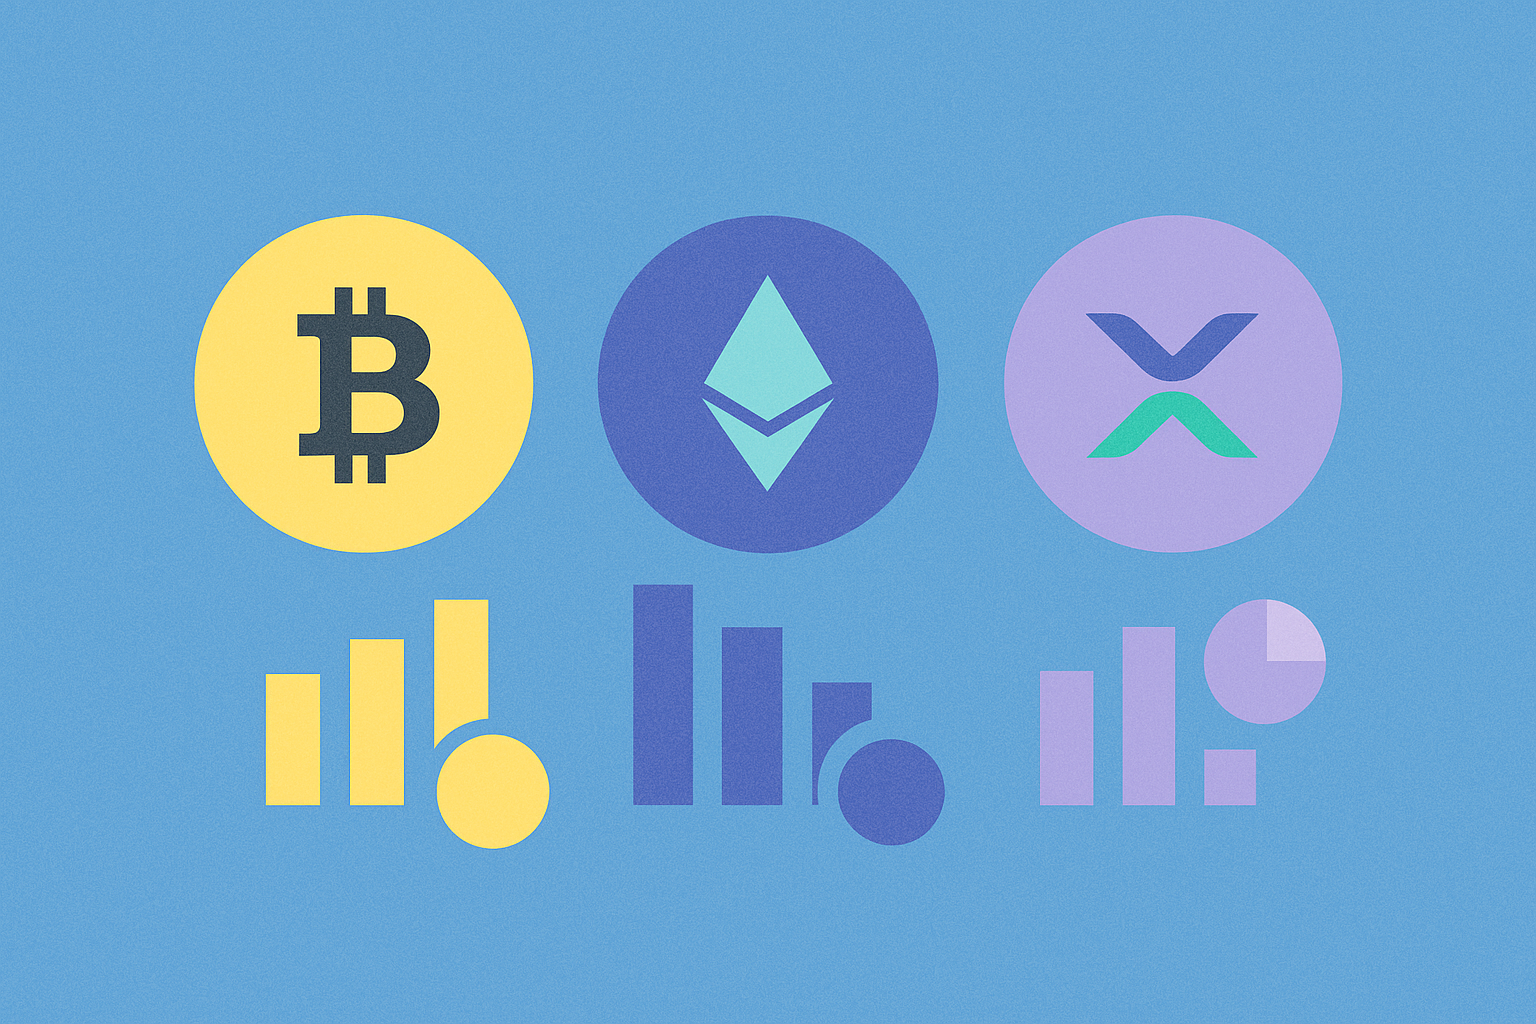
How to measure crypto community engagement and ecosystem activity in 2026

Social Media Metrics: Tracking Twitter and Telegram follower growth as primary indicators of community reach in 2026
Social media platforms serve as critical barometers for measuring genuine community engagement within cryptocurrency ecosystems. Twitter, now X, has emerged as the primary channel where crypto projects communicate roadmap updates, market developments, and engage with their most active investors. Follower growth on X often correlates with project momentum and investor confidence, making it a valuable metric for assessing community reach in 2026 and beyond.
Telegram complements Twitter as the secondary hub for direct community interaction. While Twitter follower counts indicate broadcast reach, Telegram membership reflects users seeking deeper engagement and real-time discussions. Projects with robust Telegram communities, like those listed on gate, typically demonstrate stronger retention rates than those relying solely on passive social following.
However, follower growth requires contextual interpretation. Organic growth suggests sustained interest in project developments and ecosystem activity, whereas sudden spikes might indicate promotional campaigns or external hype rather than meaningful community building. Analyzing growth velocity—the rate of follower acquisition over specific periods—provides more insight than absolute numbers alone.
In 2026, sophisticated community managers track follower sentiment alongside quantity, monitoring reply-to-follower ratios and engagement rates rather than vanity metrics. A project with 50,000 engaged Twitter followers actively participating in discussions often demonstrates stronger community health than one with 500,000 passive followers.
These social media indicators should be combined with on-chain metrics and transaction activity for comprehensive ecosystem assessment. Together, they paint a more complete picture of whether a crypto project's community engagement genuinely reflects its technological progress and market adoption potential.
Community Engagement Index: Measuring interaction frequency and participation rates across crypto platforms
The Community Engagement Index represents a quantifiable framework for assessing how actively participants interact within blockchain-based networks. This metric captures interaction frequency by tracking transaction volumes, social media activity, forum discussions, and direct platform engagement across multiple crypto platforms. By measuring participation rates, analysts can determine the proportion of community members who actively contribute to ecosystem development versus passive holders.
Interaction frequency serves as a critical component, recording metrics such as daily active users, comment threads, trading activity, and governance participation. For instance, tokens distributed across numerous exchanges—like those existing on 26 major platforms—facilitate broader participation opportunities. Similarly, holder diversity indicates engagement quality; tokens with 14,259 active holders demonstrate distributed community participation rather than centralized ownership. Participation rate analysis examines what percentage of these holders actively trade, vote, or contribute to protocol governance.
Measuring engagement across crypto platforms requires standardized approaches, including weighted scoring systems that account for platform-specific behaviors. Exchange listings, social channel followers, and developer repository activities all contribute to comprehensive engagement metrics. These measurements ultimately reflect ecosystem health, indicating whether a project maintains genuine community interest or relies on speculative participation. Understanding both interaction frequency and participation rates enables investors and projects to identify sustainable community strength versus temporary volatility-driven activity.
Developer Activity: Analyzing code commits and open-source contributions to assess ecosystem development momentum
Developer participation serves as one of the most authentic signals of long-term project viability within blockchain ecosystems. By examining code commits and open-source contributions, investors and community members gain transparent insight into the technical progression underlying a cryptocurrency platform.
GitHub repositories provide quantifiable data for this analysis. Tracking commit frequency reveals how actively developers refine existing code and implement new features. A sustained increase in monthly commits typically indicates growing development momentum, suggesting the team maintains genuine commitment to improving infrastructure and protocol functionality. Similarly, monitoring the number of contributors—whether core developers or community participants—demonstrates ecosystem vitality. Projects attracting diverse technical talent often show healthier development trajectories.
Open-source contributions extend this measurement beyond internal teams. When external developers submit meaningful pull requests, create documentation, or build tooling, it indicates the ecosystem attracts outside innovation. This organic growth distinguishes projects with genuine utility from those relying solely on speculative interest. Additionally, tracking issue resolution rates and pull request approval times reflects development efficiency and team responsiveness.
For comprehensive ecosystem assessment, correlate these metrics with release cycles and feature deployments. Consistent shipping of upgrades, security patches, and technological improvements validates that development activity translates into tangible progress. When combined with other engagement metrics, developer activity patterns provide a robust framework for evaluating cryptocurrency projects' authentic technical momentum and long-term sustainability within competitive blockchain markets.
DApp Ecosystem Expansion: Evaluating the scale and diversity of decentralized applications as a measure of ecosystem health
The proliferation of decentralized applications across multiple blockchain networks serves as a critical barometer for ecosystem vitality. A robust DApp ecosystem demonstrates its health through both quantitative scale—measured by the number of active projects and protocols—and qualitative diversity across distinct categories. Projects like those operating on BNB Chain exemplify this expansion, spanning GameFi platforms, decentralized finance solutions, and launchpad services that collectively attract diverse user segments. When evaluating ecosystem health, analysts examine the distribution of applications across verticals, as concentration in a single category may signal limited resilience. The expansion of DApp infrastructure correlates directly with community engagement levels, as more accessible and varied applications naturally draw broader participation. Furthermore, tracking the velocity of new DApp launches, their transaction volumes, and user retention rates provides concrete data points for assessing whether ecosystem growth remains sustainable. Diversification in ecosystem expansion particularly indicates maturation, as it suggests developers perceive sufficient opportunity and infrastructure stability to build specialized solutions. By monitoring DApp ecosystem metrics—including active developer counts, application feature innovation, and inter-protocol integrations—stakeholders gain meaningful insights into whether an ecosystem attracts sustained engagement or experiences temporary speculative interest.
FAQ
What are the core metrics for measuring crypto community engagement?(such as social media followers, Discord activity, governance voting participation rate, etc.)
Core metrics include social media followers and engagement rate, Discord active members and message frequency, governance voting participation rate, transaction volume, wallet holder growth, NFT trading activity, and developer GitHub commits. These indicators collectively reflect ecosystem health and community vitality.
How to assess the on-chain activity level of a crypto ecosystem? (transaction volume, active addresses, smart contract deployment, etc.)
Monitor key metrics: on-chain transaction value, daily active addresses, new smart contract deployments, TVL in DeFi protocols, and cross-chain bridge activity. Use blockchain explorers and analytics platforms to track these indicators in real-time, providing comprehensive ecosystem health assessment.
What new community engagement measurement tools and platforms are worth paying attention to in 2026?
On-chain analytics platforms like Glassnode and Nansen offer real-time wallet behavior tracking. AI-powered sentiment analysis tools monitor social discourse across Discord and Telegram. Blockchain indexing services track governance participation and NFT collection metrics. Layer-2 ecosystem dashboards provide granular activity data. These tools combine on-chain metrics, social signals, and transaction volumes for comprehensive community health assessment.
How to distinguish between genuine community engagement and fake data inflation?
Analyze on-chain metrics like active wallet addresses, transaction volume, and holder distribution rather than superficial follower counts. Examine genuine discussion quality in communities, verify token holder diversity, and monitor sustained engagement patterns over time instead of sudden spikes.
How to compare and analyze ecosystem activities between different blockchain projects?
Compare blockchain projects by analyzing on-chain transaction volume, active user addresses, smart contract deployment frequency, token holder distribution, and network security metrics. Track development activity through GitHub commits, community growth via social channels, and DeFi Total Value Locked. Use these indicators to assess ecosystem health and growth trajectory comprehensively.
What is the relationship between community engagement and the long-term value of crypto projects?
Strong community engagement directly drives project longevity and value. Active communities increase adoption, transaction volume, ecosystem development, and network effects. Higher participation signals project viability, attracts developers, and creates sustainable demand, ultimately determining long-term token appreciation and market resilience.
How are developer activity and ecosystem contributions incorporated as measurement standards in the evaluation system?
Developer activity and ecosystem contributions are measured through GitHub commits, code repository growth, smart contract deployments, developer participation in governance, ecosystem grants distribution, and technical documentation updates. These metrics reflect ecosystem health and long-term sustainability beyond transaction volume.

What Are the Key Elements of a Token Economic Model?

What is a token economic model and how does it work in crypto projects

How Does the USTC Token Economic Model Affect Its Price in 2025?

How Active is Sui's Community and Ecosystem in 2025?

How Does Cronos (CRO) Measure Community Engagement and Ecosystem Growth in 2025?

What Is the ASTER Token Economic Model and How Does It Incentivize Community Growth?
What is the difference between top cryptocurrency competitors: market cap, performance, and user adoption in 2026

How to Measure Crypto Community Engagement: Twitter Followers, Telegram Activity, and Developer Contributions

What is a crypto token economics model and how does allocation, inflation, and governance work
How does Federal Reserve policy and inflation data impact cryptocurrency prices in 2026

What is the fundamentals analysis of a crypto project: whitepaper logic, use cases, technology innovation, roadmap progress, and team background