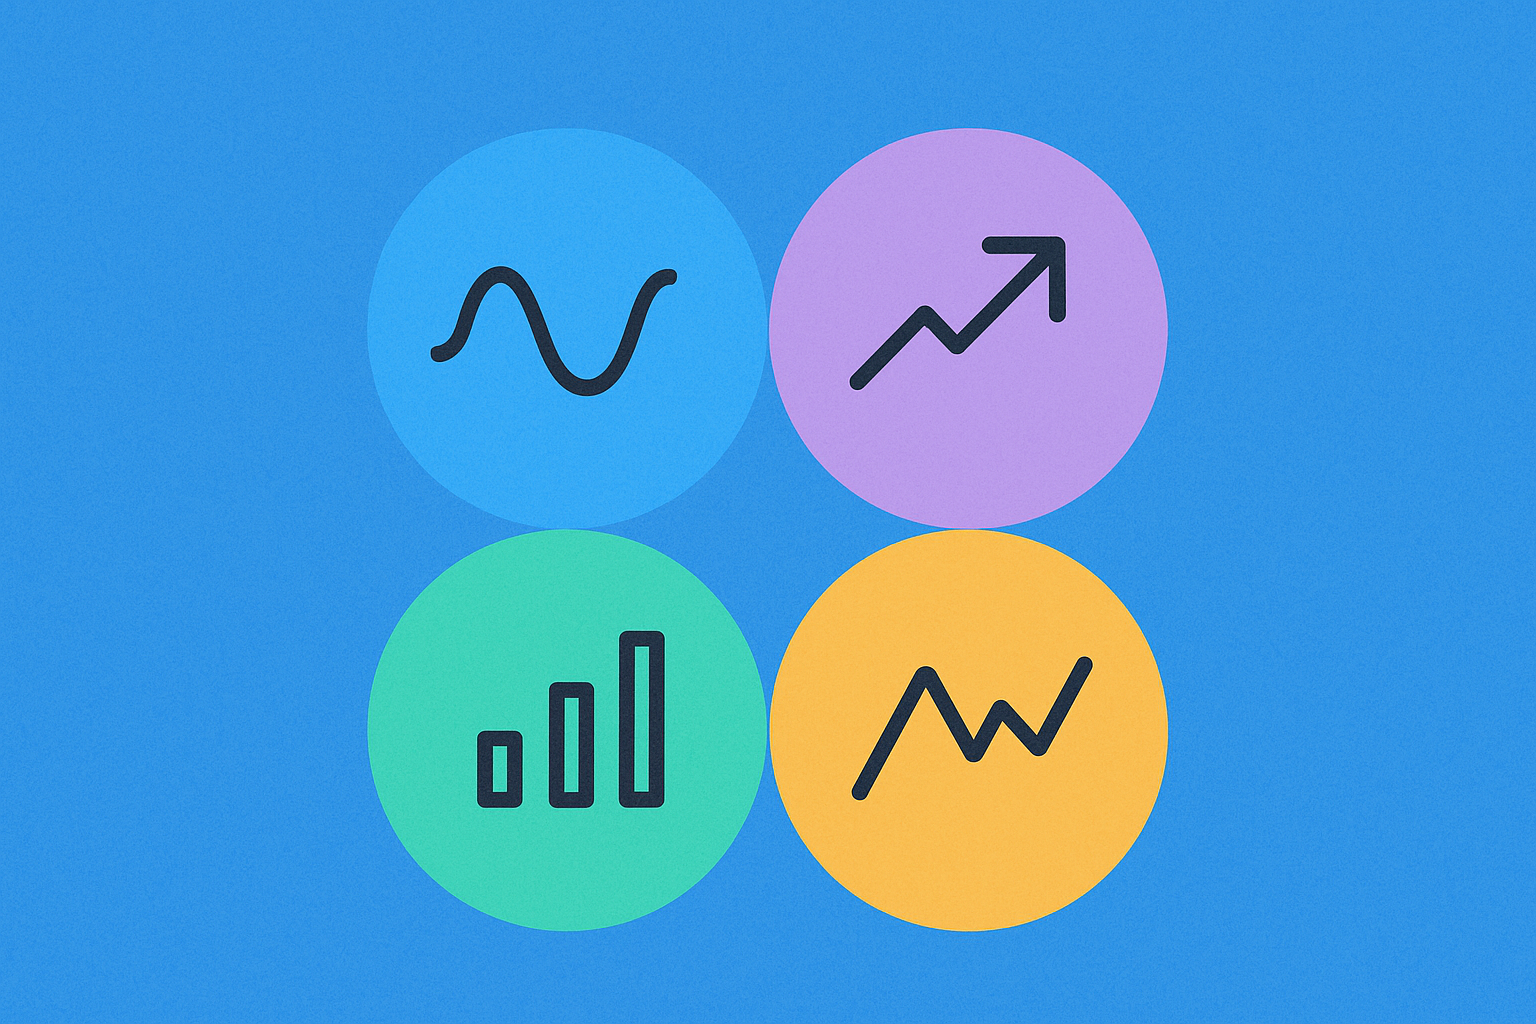
How to use MACD, RSI, and KDJ technical indicators for crypto trading analysis in 2026

MACD, RSI, and KDJ signals: identifying trend reversals and momentum shifts in crypto markets
When trading cryptocurrencies, combining MACD, RSI, and KDJ signals creates a more robust confirmation system than relying on any single indicator. MACD excels at detecting momentum shifts through its moving average crossovers, while RSI identifies overbought and oversold conditions that often precede reversals. KDJ, operating on similar principles to stochastic oscillators, provides additional confirmation of these market turning points.
The power of this three-indicator approach lies in signal convergence. When MACD generates a golden cross while RSI simultaneously shows divergence from price action, traders gain higher confidence in potential trend reversals. This synchronized signaling significantly reduces false entries that plague volatile crypto markets. For instance, Bitcoin price consolidations near key resistance levels become more actionable when RSI oversold readings align with MACD histogram expansions and KDJ signals emerging from lower zones.
Momentum shifts in crypto trading reveal themselves through divergences—when price reaches new highs but indicators fail to confirm, these hidden bearish signals warrant attention. Conversely, when price makes lower lows while MACD, RSI, and KDJ all show higher lows, bullish momentum often intensifies. Professional traders on platforms like gate layer this confluence analysis to refine entries and exits, particularly during high-volatility periods.
The 2026 crypto landscape demands refined signal confirmation techniques. Rather than chasing individual indicator crossovers, strategic traders wait for multi-indicator alignment, dramatically improving trade quality and reducing whipsaw losses in unpredictable market conditions.
Golden cross and death cross strategies: leveraging moving average systems for entry and exit signals
Moving average crossovers form the foundation of trend-following strategies in cryptocurrency trading. A golden cross occurs when a shorter-term moving average, typically the 50-day SMA, crosses above a longer-term moving average such as the 200-day SMA. This crossover signals potential bullish momentum and often marks the beginning of an uptrend. Conversely, a death cross happens when the 50-day moving average falls below the 200-day moving average, indicating bearish pressure and potential downtrend development.
These moving average systems provide clear, mechanical entry and exit signals that appeal to both novice and experienced traders. According to 2024 market data, golden cross patterns appeared 127 times across major assets, with 86 instances generating sustained upward price action over the subsequent three months—demonstrating the reliability of this approach in identifying genuine trend reversals.
However, using these signals in isolation can produce false entries. A 50/30 SMA crossover strategy on major trading pairs generated 37 false signals within six months, resulting in significant drawdowns. This underscores why professional traders combine moving average crossovers with complementary technical indicators. Pairing golden and death cross analysis with MACD confirmation, RSI divergences, or KDJ oscillator readings substantially improves signal quality by filtering out whipsaws in choppy market conditions.
For practical implementation, traders should hold positions until a reverse signal emerges—a death cross for long positions or a golden cross for short positions. Setting alert notifications on platforms like gate ensures you capture these critical crossover moments without constant chart monitoring, enabling systematic execution of this powerful yet straightforward technical strategy across multiple cryptocurrency pairs simultaneously.
Volume-price divergence analysis: confirming trend strength and detecting potential breakouts in 2026
Volume-price divergence occurs when price movement and trading volume move in opposite directions, providing critical insights into market conviction during crypto rallies and sell-offs. When price reaches new highs while volume fails to follow, it signals weakening momentum behind the move—a bearish divergence that often precedes reversals. Conversely, strong uptrends accompanied by increasing volume confirm solid participation and indicate sustainable trend strength in digital assets.
This analysis technique proves invaluable for detecting potential breakouts before they fully develop. High volume combined with price breaking above resistance levels validates the authenticity of breakout moves, distinguishing genuine breakouts from false signals that trap inexperienced traders. In trending markets, traders observe whether volume expands during each new price extension or contracts, revealing whether buyers are genuinely committed or momentum is fading.
When analyzing volume-price divergence alongside MACD, RSI, and KDJ indicators, traders gain multi-layered confirmation of trend reversals or continuations. A bearish divergence where price makes higher highs but volume makes lower highs strengthens reversal signals from momentum indicators. For breakout detection specifically, volume thrust during price breaks through key levels—whether resistance or support—provides the conviction needed to distinguish sustainable moves from temporary fluctuations. This synergy between volume analysis and traditional technical indicators enhances reliability of trading decisions in crypto markets throughout 2026.
FAQ
What are the principles of MACD, RSI, and KDJ technical indicators respectively? Which market conditions are they suitable for?
MACD measures trend momentum using moving averages; RSI identifies overbought/oversold levels through price strength; KDJ predicts reversals via stochastic analysis. MACD excels in trending markets, RSI works across conditions, KDJ performs best in ranging markets.
How to combine MACD, RSI, and KDJ indicators in cryptocurrency trading to improve trading signal accuracy?
Combine MACD and KDJ to filter false signals through dual confirmation. Pair RSI with KDJ to identify overbought/oversold levels more accurately. When KDJ shows crossover signals and MACD confirms directional momentum simultaneously, trading accuracy significantly improves.
How to identify and avoid false signals from these technical indicators in high-volatility crypto markets?
Combine MACD, RSI, and KDJ with volume analysis to filter false signals. Use multiple indicators for confirmation, avoid trading during extreme volatility, and set strict entry/exit rules based on convergence signals rather than single indicators.
Do RSI overbought and oversold levels need adjustment in crypto trading compared to traditional stock markets?
Yes, RSI levels should be adjusted for crypto trading. Standard 70/30 levels often need adjustment to 80/20 due to higher market volatility. Crypto markets are more unstable than stocks, requiring more flexible threshold settings for accurate analysis and better entry signals.
What are the differences in applying KDJ indicators between short-term trading and long-term holding?
KDJ is more effective for short-term trading, capturing rapid market opportunities through crossover signals. For long-term holding, KDJ has limited effectiveness, and other trend indicators may be more suitable for sustained momentum analysis.
How to use MACD line, signal line, and histogram to identify trend reversal points and confirm buy/sell signals?
Watch for MACD line crossovers with the signal line: upward crosses indicate buy signals, downward crosses indicate sell signals. Monitor histogram changes for momentum shifts. Positive histogram suggests bullish momentum, negative suggests bearish momentum, confirming trend reversals and entry/exit opportunities.
Will the effectiveness of these technical indicators change in the 2026 crypto market environment? How should parameters be optimized?
In 2026, indicator effectiveness shifts toward institutional-driven markets. Optimize MACD, RSI, and KDJ parameters for longer timeframes and higher trading volumes. Align strategies with regulatory clarity and sustainable fundamentals rather than sentiment-based cycles for enhanced accuracy.

How to Use MACD, RSI, and KDJ Indicators for Crypto Technical Analysis in 2026

How to Use Technical Indicators (MACD, RSI, KDJ, Bollinger Bands) to Trade Crypto in 2025?

Essential Rules for Successful Day Trading in Crypto
How to Use Technical Indicators (MACD, RSI, KDJ, Bollinger Bands) for Crypto Trading Signals

How to Use MACD, RSI, and Moving Averages for Crypto Technical Analysis in 2026

How to Use MACD, RSI, and Bollinger Bands to Identify Crypto Trading Signals?

What is Banana Gun (BANANA) market overview with $7.81 price and $85,202 24-hour trading volume in 2026

How active is BANANA cryptocurrency community and ecosystem in 2026?

What is ALPINE price volatility: why did it surge 19.39% with 23.90% daily volatility in 2025

What are the key differences between Alpine and its competitors in the crypto market share comparison?

How do active addresses and whale movements impact on-chain data analysis for crypto trading?