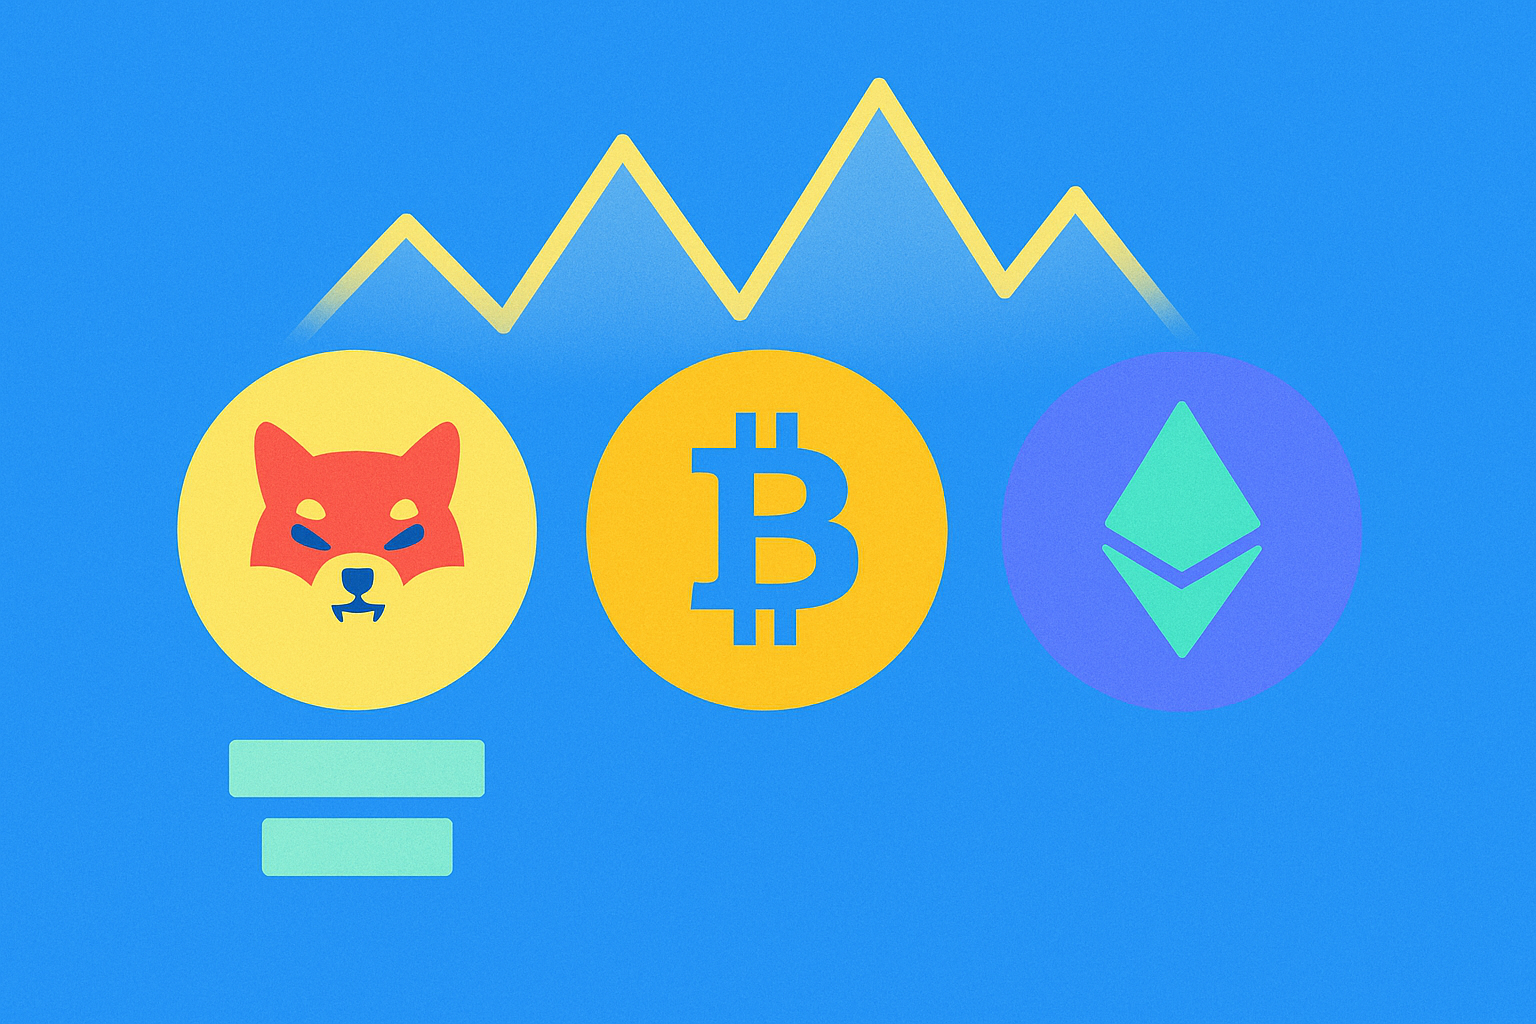
# How Will Shiba Inu (SHIB) Price Volatility Evolve by 2027? Support and Resistance Analysis

Historical Price Volatility: SHIB Trading Range Between $0.000012 and $0.000017 in September 2025
Throughout September 2025, Shiba Inu demonstrated notable price volatility contained within a clearly defined range, providing crucial insights into market structure and potential support mechanisms. SHIB traded at $0.00001220 on September 25, with the broader trading activity establishing boundaries between $0.000012 and $0.000017. More specifically, technical analysis revealed the daily chart locked inside a consolidation band spanning from $0.00001180 to $0.00001470, indicating sustained buyer interest at lower price levels and systematic resistance at upper boundaries.
This narrow trading pattern reflected active range trading dynamics, where market participants defended short-term support while sellers maintained overhead pressure. The formation of a double-bottom pattern emerged during this period, coupled with symmetrical consolidation structures that typically precede directional breakouts. On September 1, 2025, SHIB recorded 24-hour trading volume of $150 million, demonstrating sufficient liquidity to support price movement through these established levels.
Analysts interpreted this consolidation phase as buyers defending critical support zones, suggesting market equilibrium between accumulation and distribution phases. Understanding this September volatility pattern proves essential for projecting how SHIB price volatility might evolve toward 2027, as consolidation periods often precede substantial directional moves.
Technical Support and Resistance Levels: Key Price Targets from $0.00000614 to $0.000049 by 2027
Technical analysis reveals that Shiba Inu's price trajectory through 2027 will be fundamentally shaped by key support and resistance zones that serve as psychological and functional trading boundaries. The lower support level at $0.00000614 represents a critical floor where buying pressure historically accumulates, protecting against further downside momentum. This level acts as a defensive barrier for long-term holders, with technical indicators suggesting that breaks below this zone could trigger bearish sentiment.
Conversely, the resistance target of $0.000049 by 2027 represents an ambitious but achievable ceiling given current market conditions and growth projections. Intermediate resistance points exist at $0.000016 and $0.0000131, with the latter representing the expected 2025 price level based on current technical frameworks. These layered resistance zones create natural profit-taking opportunities as SHIB attempts to break higher, requiring substantial volume confirmation to penetrate each level.
The distance between support at $0.00000614 and resistance at $0.000049 creates a defined trading range that traders utilize for technical analysis and volatility assessment. Breaking above the $0.000016 resistance would signal strengthening bullish momentum toward 2027 targets, while retreating below $0.000011 current support would suggest reaccumulation near the $0.00000614 support level. These technical support and resistance levels provide crucial reference points for understanding how SHIB's price volatility may evolve through market cycles leading to 2027.
Market Correlation Impact: SHIB's High Positive Correlation with Bitcoin and Ethereum Drives Short-Term Price Movements
Shiba Inu's price movements have historically demonstrated strong positive correlation with Bitcoin and Ethereum, creating a synchronized trading pattern that shapes short-term volatility across the broader cryptocurrency market. From 2020 through 2025, SHIB consistently tracked the major cryptocurrencies during both bull rallies and market corrections, with significant price comovement occurring during periods of elevated volatility. This correlation reflects the interconnected nature of crypto asset classes, where Bitcoin and Ethereum serve as market bellwethers that influence capital flows across the entire ecosystem.
The mechanism driving this correlation involves multiple layers of market dynamics. Large institutional investors frequently employ paired trading strategies with Bitcoin and Ethereum, which indirectly impacts SHIB through broader liquidity flows and sentiment shifts. When Bitcoin experiences sharp moves, retail capital and leveraged positions cascade through smaller-cap altcoins like SHIB, amplifying short-term price swings. Market liquidity conditions and volatility regimes further reinforce this relationship, as periods of systemic risk typically trigger synchronized liquidations across correlated assets. However, the relationship isn't purely mechanical—SHIB's relatively weak on-chain activity and limited ecosystem developments can cause temporary divergence from Bitcoin and Ethereum during certain market phases, suggesting that long-term price trends ultimately reflect fundamental factors beyond correlation alone.
FAQ
How high can SHIB go realistically?
SHIB could realistically reach $0.001 based on market projections and adoption trends. If SHIB achieved Bitcoin's current market cap, price could reach approximately $0.003, representing substantial growth from current levels.
Can SHIB hit 1 cent by 2030?
Reaching 1 cent by 2030 requires significant market growth and sustained community support. While theoretically possible with favorable conditions, current price levels suggest this would need substantial adoption and ecosystem expansion to achieve such valuations.
How high will Shiba Inu go in 2026?
Based on algorithmic analysis, Shiba Inu is predicted to reach approximately $0.00008287 by January 2026. This forecast suggests a potential 15.95% increase from current levels. Market conditions and adoption trends may influence actual price movements.
What is the future price prediction for a Shiba Inu in 2030?
Based on market analysis, Shiba Inu price is predicted to range between $0.00004156 and $0.00005261 by 2030, driven by ecosystem development and adoption growth.
What are the key support and resistance levels for SHIB in 2027?
Based on current technical analysis, SHIB's 2027 support level is projected around $0.00002312. Resistance levels are expected to form at $0.00005000 and $0.00010000, depending on market momentum and adoption growth during this period.
How will SHIB price volatility change from 2024 to 2027?
SHIB volatility is expected to increase through 2027, with wider price ranges and more active trading. By 2027, predictions show maximum volatility reaching $0.00002409, indicating significant fluctuation potential compared to 2024 levels.
What factors will influence SHIB's price movement by 2027?
SHIB's price by 2027 will be influenced by Shibarium development progress, token burn rates, cryptocurrency market sentiment, adoption metrics, and macroeconomic conditions affecting the broader digital asset landscape.
FAQ
Will shiba coin reach $1?
Reaching $1 would require Shiba Inu to increase over 12 million percent from current levels. While unlikely given current tokenomics, significant ecosystem developments and adoption could reshape its potential long-term trajectory.
Will SHIB coin be worth anything?
Yes, SHIB maintains value as a speculative digital asset with active community support and blockchain utility through Shibarium. Its worth depends on market demand, adoption, and broader crypto sentiment, making it potentially valuable for long-term investors.
Will Shiba reach $1 dollar by 2030?
Reaching $1 by 2030 is highly unlikely. The token would require an 834% annualized growth rate, which is unrealistic given current market conditions and trajectory.
What will SHIB be worth in 2025?
SHIB's value depends on market adoption, utility development, and broader crypto trends. While precise predictions are speculative, growing ecosystem projects and community support suggest potential for continued growth. Monitor market fundamentals and your investment goals.
What is Shiba Inu (SHIB) coin and how does it work?
Shiba Inu (SHIB) is a decentralized cryptocurrency built on blockchain technology. Originally launched as a meme coin, it has evolved into a Web3 platform supporting decentralized applications. SHIB operates through smart contracts, enabling peer-to-peer transactions and ecosystem participation with community-driven governance.
How do I buy and store SHIB coins?
Purchase SHIB through a secure crypto exchange using your preferred payment method. Store your coins in a personal wallet for security, with hardware wallets offering the highest protection level.
What are the risks of investing in SHIB coin?
SHIB carries high volatility as a meme token, limited practical applications compared to major projects, market underregulation exposure, and susceptibility to fraudulent schemes using SHIB's name to deceive investors.
What is the current circulating supply and total supply of SHIB?
SHIB's circulating supply is approximately 589.29 trillion tokens, while the total supply is approximately 589.53 trillion tokens. The difference between the two represents tokens that are not yet in active circulation.
How does SHIB compare to Dogecoin?
SHIB is an Ethereum-based token often called the Dogecoin killer. As of December 2025, Dogecoin leads with a $22.35 billion market cap versus SHIB's $5.07 billion. SHIB focuses on ecosystem development through Shibarium, while Dogecoin maintains larger trading volume and market dominance.
Is SHIB a good long-term investment?
SHIB shows promising long-term potential with strong community support and growing utility. Its deflationary tokenomics and ecosystem development position it well for future growth. Early investors may see significant returns as adoption increases.

How Has the Crypto Market Volatility Affected Price Support and Resistance Levels?

What Are the Key Price Support and Resistance Levels for Crypto in 2025?

How Has the Crypto Market Volatility Affected Price Movements in 2025?

# How to Analyze Solana (SOL) Price Volatility: Support and Resistance Levels in 2025-2026

Understanding Altcoin Season: Timing, Trends, and Impact

# How Does Chainlink (LINK) Price Volatility Compare to Bitcoin and Ethereum in 2025?

What Is XRP Price Prediction for 2024?
How does Federal Reserve policy and inflation data impact crypto prices in 2026
XRP Surges with Institutional Momentum and Regulatory Clarity
What is AAVE market cap and trading volume in 2026: Price, supply, and liquidity overview
How does Federal Reserve policy impact cryptocurrency prices in 2026?