fomox
MarketsPerpsSpotSwap
Meme
Referral
More
Search Token/Wallet
/

Mastering Candlestick Patterns: Decoding Signals in Crypto Trading

2025-12-19 03:40:55
Crypto Trading
Crypto Tutorial
Spot Trading
Trading Bots
Web 3.0
Article Rating : 3
50 ratings
Explore the art of mastering candlestick patterns to enhance your crypto trading strategies in this comprehensive guide. Understand key candlestick components—body, wicks, and color—necessary for accurate signal interpretation. Learn to identify common bullish and bearish signal patterns like Hammer, Bullish Engulfing, Shooting Star, and more. Discover effective trading techniques using candlestick signals, including risk management, pattern combinations, and integration with other tools. Perfect for traders seeking to improve their pattern recognition and market analysis skills.
Mastering Candlestick Patterns: Decoding Signals in Crypto Trading

Understanding Candle Stick Signal Patterns for Better Trading Decisions

What is a Candle Stick Signal?

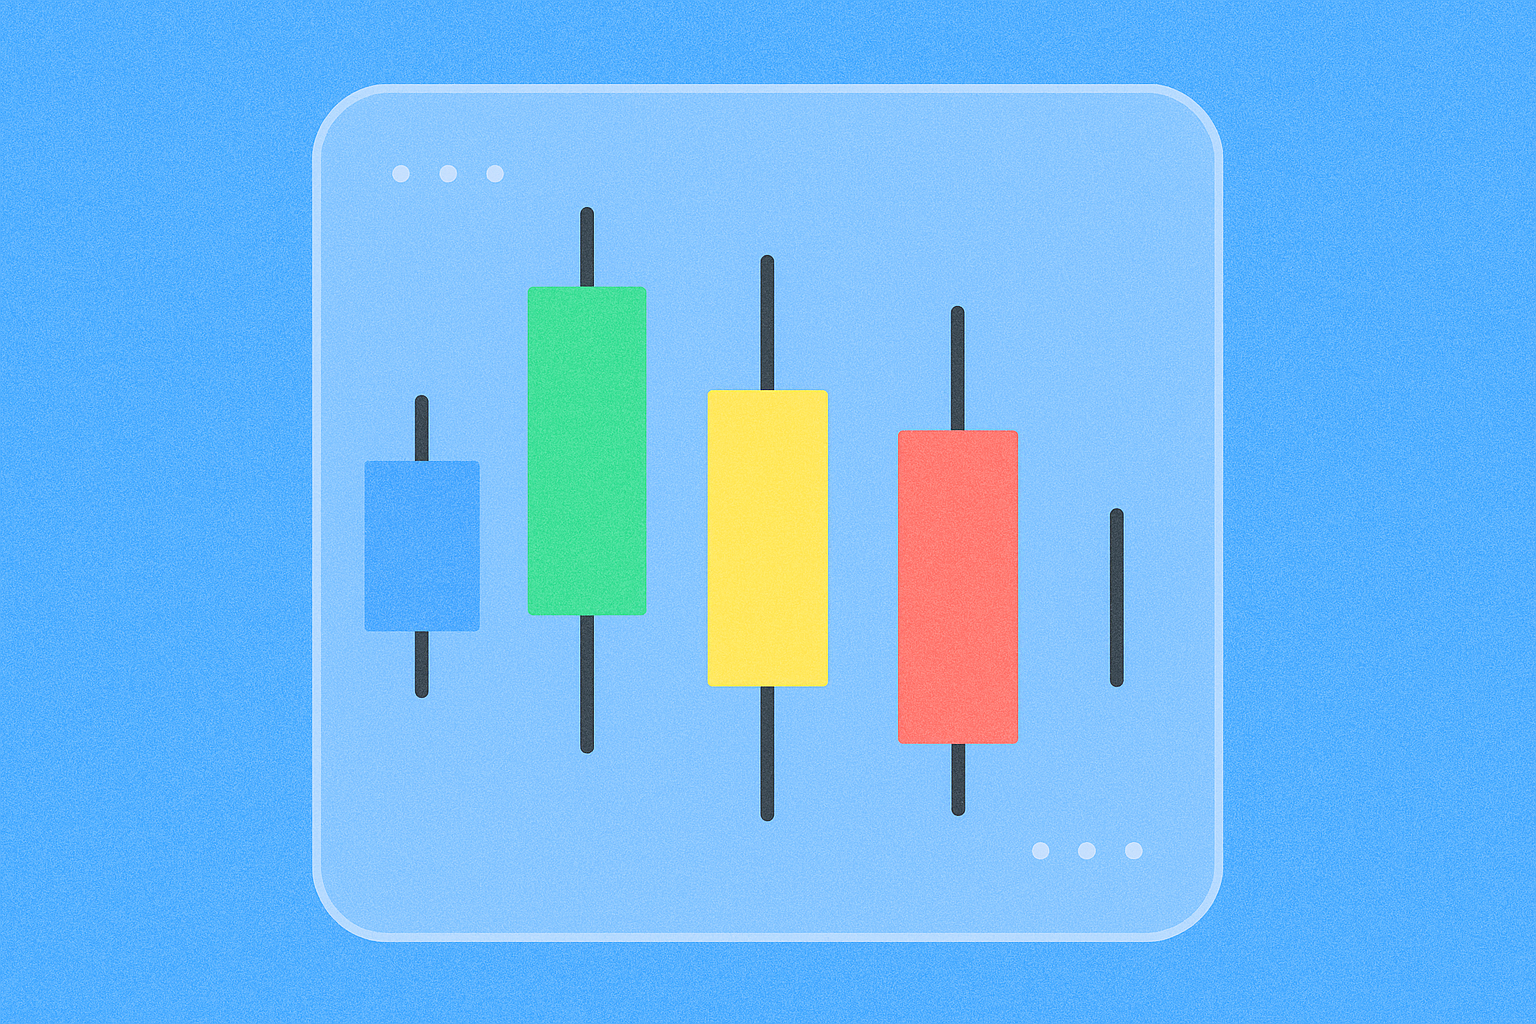
A candle stick signal represents a visual pattern formed by price movements in financial markets, displayed through candlestick charts. Each candle stick signal provides valuable information about market sentiment, showing the opening, closing, high, and low prices within a specific time frame. These signals have been used by traders for centuries to predict potential market movements and make informed trading decisions.

Key Components of Candle Stick Signals

Understanding the anatomy of a candle stick signal is essential for proper interpretation:

  • Body: The rectangular area between opening and closing prices
  • Wicks/Shadows: The lines extending above and below the body, showing price extremes
  • Color: Green/white indicates bullish movement, red/black indicates bearish movement

Common Candle Stick Signal Patterns

Bullish Candle Stick Signals

Hammer Signal The hammer candle stick signal appears at the bottom of downtrends, featuring a small body with a long lower wick. This signal suggests potential reversal as buyers are stepping in to push prices higher.

Bullish Engulfing This powerful candle stick signal occurs when a larger green candle completely engulfs the previous red candle, indicating strong buying pressure and potential trend reversal.

Morning Star A three-candle formation that serves as a reliable candle stick signal for trend reversal, consisting of a bearish candle, a small-bodied candle, and a strong bullish candle.

Bearish Candle Stick Signals

Shooting Star This candle stick signal appears at the top of uptrends, with a small body and long upper wick, suggesting that sellers are gaining control.

Bearish Engulfing A strong reversal candle stick signal where a large red candle engulfs the previous green candle, indicating increased selling pressure.

Evening Star The bearish counterpart to the morning star, this three-candle stick signal pattern warns of potential downward reversals.

How to Read Candle Stick Signals Effectively

Context Matters

Never interpret a candle stick signal in isolation. Consider:

  • Overall market trend
  • Volume indicators
  • Support and resistance levels
  • Multiple timeframe analysis

Confirmation is Key

Wait for confirmation before acting on any candle stick signal. A single pattern may provide hints, but confirmation through subsequent price action or additional indicators strengthens reliability.

Timeframe Selection

Candle stick signals appear across all timeframes, from one-minute charts to monthly charts. Longer timeframes typically provide more reliable signals, though they require more patience.

Practical Application of Candle Stick Signals

Entry and Exit Points

Use candle stick signals to identify optimal entry points when patterns align with your trading strategy. Exit signals help protect profits and minimize losses when reversal patterns emerge.

Risk Management

Combine candle stick signal analysis with proper stop-loss placement. Position stops beyond the signal's key levels to avoid premature exits while protecting capital.

Integration with Other Tools

Enhance candle stick signal effectiveness by combining them with:

  • Moving averages
  • RSI (Relative Strength Index)
  • MACD (Moving Average Convergence Divergence)
  • Fibonacci retracement levels
  • Volume analysis

Advanced Candle Stick Signal Strategies

Pattern Combinations

Multiple candle stick signals appearing together strengthen the case for a trade. For example, a hammer signal at a major support level with bullish divergence on RSI creates a high-probability setup.

Market Psychology

Each candle stick signal reflects the battle between buyers and sellers. Understanding the psychology behind these patterns helps anticipate market behavior more accurately.

Backtesting

Test candle stick signal patterns on historical data to understand their success rates in different market conditions. This practice builds confidence and refines your pattern recognition skills.

Common Mistakes When Using Candle Stick Signals

Overtrading

Not every candle stick signal warrants action. Be selective and focus on high-probability setups that align with your overall strategy.

Ignoring Market Context

A bullish candle stick signal in a strong downtrend may be a temporary bounce rather than a reversal. Always consider the broader market environment.

Lack of Patience

Rushing into trades before proper confirmation of the candle stick signal often leads to losses. Wait for validation through subsequent price action.

Candle Stick Signals in Different Market Conditions

In strong trends, continuation candle stick signals like flags and pennants prove more reliable than reversal patterns. The trend is your friend until proven otherwise.

Range-Bound Markets

Reversal candle stick signals near support and resistance levels work exceptionally well in sideways markets, offering clear risk-reward setups.

Volatile Markets

During high volatility, candle stick signals may generate false readings. Adjust position sizes and use wider stops to accommodate increased price swings.

Improving Your Candle Stick Signal Recognition

Regular Practice

Study charts daily to develop pattern recognition skills. The more candle stick signals you identify, the faster and more accurate your analysis becomes.

Keep a Trading Journal

Document each candle stick signal you trade, including context, execution, and outcome. This record helps identify strengths and weaknesses in your approach.

Continuous Learning

Markets evolve, and so should your understanding of candle stick signals. Stay updated with market dynamics and adapt your strategies accordingly.

Conclusion

Mastering candle stick signal interpretation is a valuable skill for any trader. These visual patterns provide insights into market psychology and potential price movements. By understanding various candle stick signal patterns, applying them within proper context, and combining them with other analytical tools, traders can significantly improve their decision-making process. Remember that no single candle stick signal guarantees success—consistent profitability comes from disciplined application, proper risk management, and continuous refinement of your trading approach.

Start with basic patterns, practice regularly, and gradually incorporate more complex candle stick signal strategies into your trading arsenal. With patience and dedication, these timeless technical analysis tools can become a cornerstone of your trading success.

FAQ

What are candlestick signals?

Candlestick signals are chart patterns that indicate potential price movements. They include reversal signals like Doji and continuation signals like Hammer, helping traders make informed trading decisions based on historical price and trading volume data.

What is the 3 candle rule?

The 3 Candle Rule is a technical analysis strategy examining three consecutive candlesticks to identify potential price reversals or trend continuations, helping traders spot market opportunities and make informed trading decisions.

How do you read candlesticks for beginners?

Each candlestick represents a time period showing open, close, high, and low prices. The body shows opening and closing prices, while wicks display the highest and lowest prices. Green candles indicate price increases, red candles show price decreases.

What are the four parts of a candlestick?

A candlestick consists of four key parts: the open price, the high price, the low price, and the close price. These represent the price action during a specific time period.

* The information is not intended to be and does not constitute financial advice or any other recommendation of any sort offered or endorsed by Gate.

Share

Content

What is a Candle Stick Signal?

Key Components of Candle Stick Signals

Common Candle Stick Signal Patterns

How to Read Candle Stick Signals Effectively

Practical Application of Candle Stick Signals

Advanced Candle Stick Signal Strategies

Common Mistakes When Using Candle Stick Signals

Candle Stick Signals in Different Market Conditions

Improving Your Candle Stick Signal Recognition

Conclusion

FAQ

Related Articles
Understanding the Various Order Types: Market, Limit, and Stop-Limit

Understanding the Various Order Types: Market, Limit, and Stop-Limit

A detailed guide to Buy Limit Orders in crypto trading: definitions, how to use them, comparison with Market Orders, and instructions for placing orders on Gate. Ideal for new traders and Web3 investors seeking greater control over trade execution prices.
2026-01-08 13:05:01
Scalp là gì?

Scalp là gì?

# Chiến lược Scalp trong giao dịch tiền điện tử là gì? Scalp là chiến lược giao dịch kiếm lợi nhuận từ những biến động giá nhỏ trong thời gian siêu ngắn (vài giây đến vài phút), phù hợp với trader muốn tối ưu hóa từng chuyển động thị trường. Bài viết này trình bày cơ chế hoạt động của scalp, ưu nhược điểm, ứng dụng thực tế và so sánh với các chiến lược giao dịch khác. Hệ thống kiến thức bao gồm kỹ thuật phân tích, quản lý rủi ro, cùng hướng dẫn thực hiện hiệu quả trên các sàn giao dịch chính như Gate, nơi cung cấp công nghệ tiên tiến và điều kiện giao dịch ưu việt cho scalper.
2026-01-05 03:10:23
Volume-Weighted Average Price (VWAP)

Volume-Weighted Average Price (VWAP)

This comprehensive guide explores Volume-Weighted Average Price (VWAP), a critical trading benchmark that combines price movements with trading volume to determine fair market value. VWAP serves as an essential tool for institutional investors, algorithmic traders, and retail investors seeking to optimize order execution and improve trading performance across stocks, commodities, and cryptocurrencies. The article covers VWAP calculation methodology, its significance in market assessment, and practical applications in algorithmic trading strategies that help minimize market impact on large orders. It demonstrates real-world examples of strategic order execution and explains how VWAP integrates with other technical indicators for comprehensive market analysis. Accessible on leading platforms like Gate, VWAP provides traders with dynamic reference points for identifying entry and exit opportunities while evaluating execution quality against market benchmarks throughout the trading session.
2026-01-10 14:40:46
Decoding the KDJ Indicator: A Comprehensive Guide

Decoding the KDJ Indicator: A Comprehensive Guide

"Decoding the KDJ Indicator" is a comprehensive guide for traders and analysts, focusing on the KDJ as a short-term analysis tool in financial markets. It explains the indicator's components: K-line, D-line, and J-line, and their roles in identifying overbought and oversold conditions. The article highlights key usage rules and signals like Golden and Death Crosses, and divergence detection. It also discusses the practical application of KDJ in day trading and crypto markets, guiding readers on decision-making with it and addressing FAQs for deeper understanding. Suitable for traders seeking clearer insights into price movements and market sentiment.
2025-11-26 09:10:48
How to Interpret MACD and RSI Signals for Cryptocurrency Trading?

How to Interpret MACD and RSI Signals for Cryptocurrency Trading?

This article offers a comprehensive guide to interpreting MACD and RSI signals, essential for optimizing cryptocurrency trading strategies. It explores the fundamentals of these indicators and their application in analyzing trends and momentum. The piece addresses the challenges of false signals by integrating volume analysis, providing a robust trading framework. Targeted at traders, especially those in Gate, the article enhances decision-making by combining technical indicators and market data effectively. Keywords such as MACD, RSI, and volume are emphasized for readability and quick understanding.
2025-12-04 03:56:42
Understanding Take-Profit in Cryptocurrency Trading

Understanding Take-Profit in Cryptocurrency Trading

Mastering take profit in crypto trading is essential for effective risk management and strategic optimization. Discover how to configure take profit and stop loss orders on Gate to automate your transactions and enhance overall trading results.
2025-12-05 08:45:01
Recommended for You
What is an ETH ETF?

What is an ETH ETF?

Explore our complete guide to Ethereum ETFs, designed for both beginner and intermediate investors. Learn about the benefits, operation, and top strategies for investing in Ethereum using regulated, secure ETFs.
2026-01-12 14:07:19
What is the Babylon Chain?

What is the Babylon Chain?

Babylon Chain is a groundbreaking Bitcoin Layer 2 solution that transforms dormant BTC into a productive staking asset, addressing the critical inefficiency of billions in idle Bitcoin capital. The protocol enables Bitcoin holders to earn attractive yields while securing Proof-of-Stake blockchains through a trustless, slashable staking mechanism that eliminates custody risks and bridge vulnerabilities. Babylon's innovative architecture leverages Bitcoin's unparalleled security to help emerging PoS networks bootstrap robust infrastructure without relying solely on volatile native tokens. Key features include fully slashable security, enhanced staker liquidity, and Bitcoin timestamping services that strengthen on-chain integrity. With integrations across leading platforms like Osmosis and Akash, supported by $18 million in funding from top venture firms, Babylon establishes Bitcoin as the foundational security layer for the decentralized economy while creating a symbiotic ecosystem benefiting both BTC holders a
2026-01-12 14:04:42
What are DAOs and How Do They Work?

What are DAOs and How Do They Work?

This comprehensive guide explores Decentralized Autonomous Organizations (DAOs), explaining how blockchain technology enables communities to govern themselves through smart contracts and token-based voting systems. The article covers DAO fundamentals, operational mechanics, and their advantages including decentralization, transparency, and efficiency compared to traditional corporate structures. It also addresses critical challenges such as security vulnerabilities, governance attacks, and the concentration of voting power among large token holders. Through real-world examples like the Build Finance DAO incident, readers gain insight into both the revolutionary potential and practical limitations of DAOs. The guide concludes with practical FAQs covering participation requirements, investment considerations, and successful DAO implementations, positioning DAOs as an evolving governance model requiring careful security and oversight as the ecosystem matures.
2026-01-12 14:02:05
Zama Airdrop Guide: How to Participate and Claim $ZAMA Rewards

Zama Airdrop Guide: How to Participate and Claim $ZAMA Rewards

Zama (ZAMA) is a privacy-first blockchain platform leveraging Fully Homomorphic Encryption (FHE) technology for confidential smart contracts and secure computation. This comprehensive guide walks you through maximizing airdrop rewards by joining the public testnet, earning points through social engagement and testnet participation, and verifying your wallet before claiming tokens in Q3 2025. Learn the tokenomics structure, strategic participation tips, and price outlook ranging from $0.000024-$0.000035 short-term to potential $0.35-$1.22 long-term as the ecosystem expands. Whether you're a privacy advocate, blockchain developer, or Web3 enthusiast, participating in Zama's airdrop program on Gate offers immediate token rewards while contributing to next-generation blockchain privacy infrastructure.
2026-01-12 13:53:01
Tabi (TABI) Airdrop Guide: How to Participate and Claim $TABI Rewards?

Tabi (TABI) Airdrop Guide: How to Participate and Claim $TABI Rewards?

Explore our complete Tabi (TABI) airdrop guide—learn how to participate, claim your rewards, implement Web3 strategies, and review price forecasts. Start earning free tokens now on Gate.
2026-01-12 13:50:18
Unipoly Airdrop Guide: How to Participate and Claim $UNP Rewards

Unipoly Airdrop Guide: How to Participate and Claim $UNP Rewards

Discover Unipoly (UNP), a pioneering GameFi platform integrating Play-to-Earn gaming, social networking, and Web3 development tools. This comprehensive guide walks you through claiming UNP airdrop rewards by participating in the Kuki gaming platform, engaging on UniTribe social network, and leveraging the Creator Ecosystem. Learn the step-by-step participation process, from account registration to wallet connection, while understanding UNP tokenomics with 30% community allocation. Track the airdrop timeline, exchange listings on Gate and other platforms, and explore price projections ranging from $0.20-$0.77 based on ecosystem expansion. Maximize your rewards through consistent engagement, referral programs, and multi-platform participation in this thriving blockchain gaming ecosystem.
2026-01-12 13:47:41