Mastering the Rising Expanding Wedge Pattern in Cryptocurrency Analysis

Breakout or Breakdown: Explaining the Rising Wedge Pattern in Crypto Trading
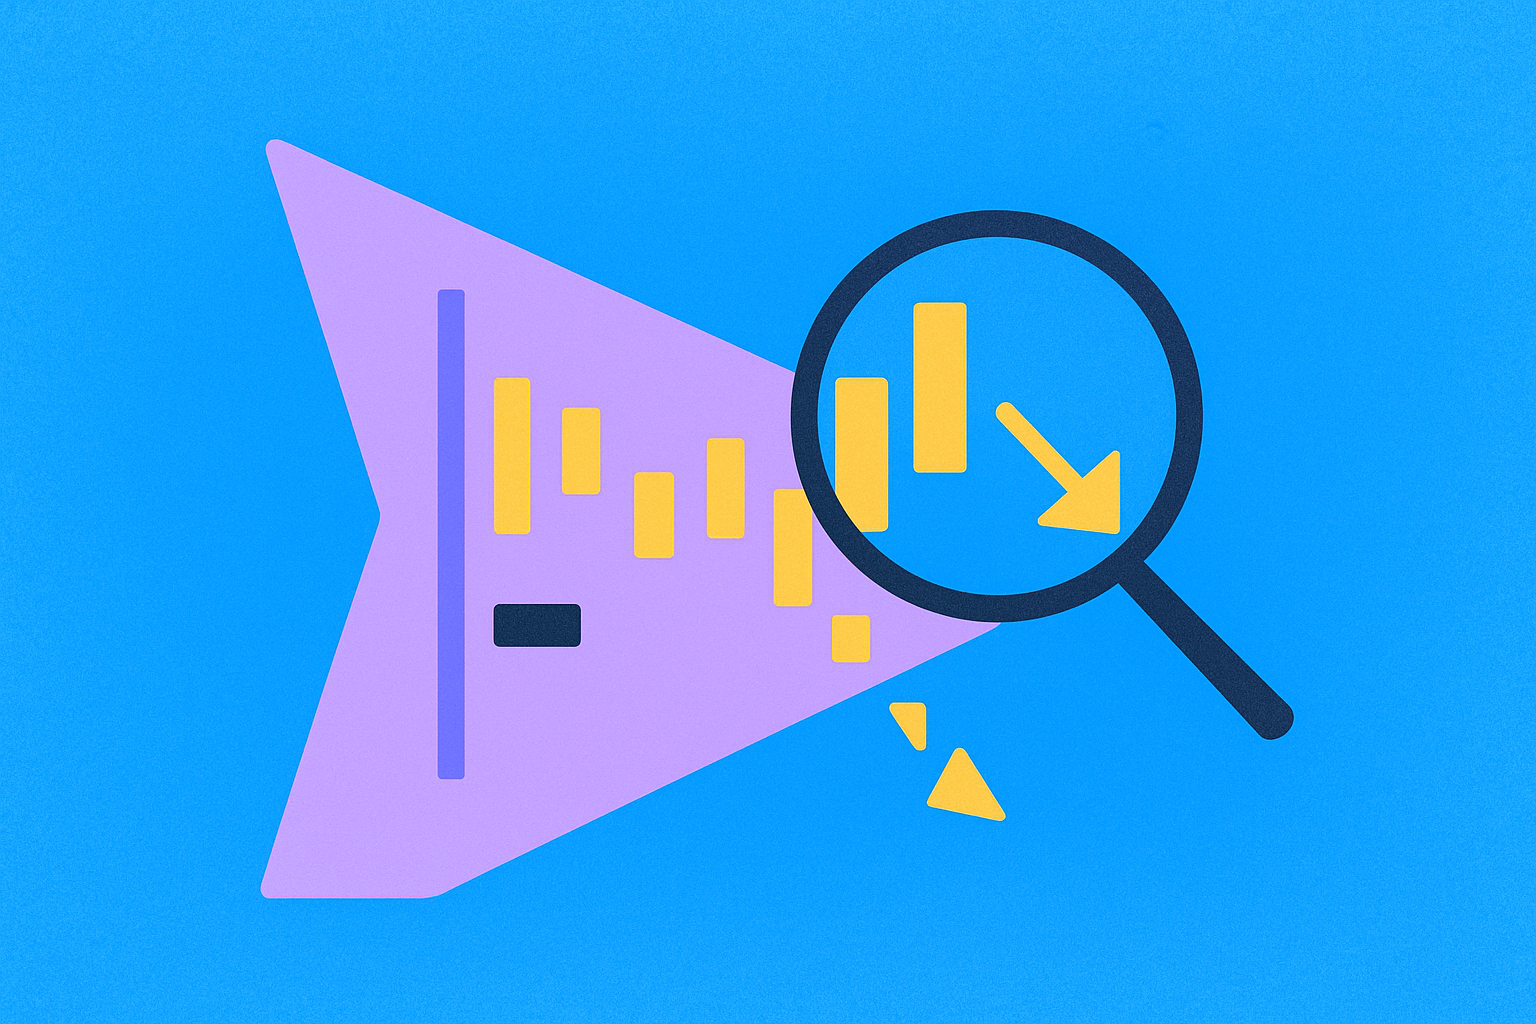
In the volatile world of cryptocurrency trading, distinguishing between genuine price rallies and false breakouts is crucial for traders seeking to protect their portfolios and maximize profits. The rising wedge pattern represents one of the most important technical indicators that helps traders identify potential trend reversals and avoid falling victim to deceptive price movements. This comprehensive guide explores the rising wedge pattern, its characteristics, and practical applications in cryptocurrency trading.
What is a rising wedge in crypto?
The rising wedge is a technical chart pattern characterized by a narrowing, upward-sloping price channel that frequently signals an impending bearish trend reversal. This pattern applies specifically to digital assets such as Bitcoin (BTC) and Ethereum (ETH), though similar formations exist in traditional financial markets like stock trading.
During the formation of a rising wedge, a cryptocurrency exhibits a distinctive behavior: it repeatedly reaches higher price peaks while simultaneously bouncing off progressively higher lows, creating a convergence pattern that eventually reaches an apex point. Traders utilize two key trend lines to identify and analyze this pattern: a resistance line drawn along the upper price boundaries and a support line drawn along the lower price boundaries. The convergence of these lines creates the wedge shape, and traders typically anticipate a price breakdown below the support line once the pattern reaches its culmination point.
Key characteristics of an ascending wedge
The ascending wedge pattern presents several distinctive features that help traders identify it on cryptocurrency charts. At first glance, this pattern may appear to signal bullish momentum since the cryptocurrency consistently achieves higher prices without falling below previous lows. However, closer examination reveals important subtleties that distinguish it from genuine uptrends.
A critical characteristic of the ascending wedge is the relationship between its support and resistance lines. While both lines slope upward, the support line typically rises at a steeper angle than the resistance line, creating the characteristic narrowing formation. This geometric relationship suggests that while buyers continue pushing prices higher, their ability to maintain momentum is gradually diminishing as the price range contracts.
Another essential feature of ascending wedges is the accompanying decline in trading volume. Traders carefully monitor volume indicators displayed in bar graphs beneath price charts, comparing current activity levels with historical averages and previous trading periods. When volume decreases noticeably during an apparent uptrend, it suggests weakening market participation and decreased conviction among buyers. This divergence between rising prices and falling volume serves as a red flag, indicating that the current price action may not be sustainable and could be vulnerable to reversal.
Is the ascending wedge bullish or bearish?
The ascending wedge pattern stands as one of the most misleading formations in technical cryptocurrency analysis, frequently deceiving inexperienced traders with its superficially bullish appearance. Despite the continuous higher highs and higher lows that characterize this pattern, technical analysts traditionally interpret it as a bearish reversal indicator rather than a sign of continued upward momentum.
Many experienced traders classify ascending wedges as "bull traps" because they lure optimistic traders into establishing long positions based on the apparent uptrend, only to suffer significant losses when the pattern resolves with a sharp downward price movement. The fundamental reason for this bearish interpretation lies in the divergence between price action and market fundamentals. When prices rise steadily but trading volume remains below average, it indicates insufficient buying pressure to sustain the rally. This lack of strong demand means that even moderate selling pressure can trigger a substantial price collapse, catching unsuspecting bulls off guard.
For example, if Bitcoin appears to be in a strong uptrend within an ascending wedge formation but shows declining volume throughout the pattern's development, traders should interpret this as a warning signal rather than a buying opportunity. The pattern suggests that the current price levels are unsustainable and vulnerable to a significant correction.
Is a rising wedge pattern the same as a rising flag pattern?
While rising wedges and bull flags share some superficial similarities in name and appearance, they represent fundamentally different price dynamics and carry opposite implications for future price movements in cryptocurrency markets.
The bull flag pattern, unlike the rising wedge, is traditionally interpreted as a bullish continuation pattern, signaling that traders should expect the cryptocurrency's upward trend to resume after a brief consolidation period. The bull flag formation begins with a dramatic, high-volume price surge represented by long green candlesticks that form the "flagpole." This initial movement demonstrates strong buying interest and genuine market momentum.
Following this explosive upward movement, the bull flag enters a consolidation phase characterized by lower trading volume and a narrow price range that resembles a rectangular flag, often with a slight downward tilt. During this consolidation, the price bounces between clearly defined support and resistance levels several times before ultimately breaking out to the upside. Momentum traders typically wait for confirmation of this upward breakout, accompanied by higher-than-average volume, before entering long positions. The expected price target following a bull flag breakout often equals the height of the initial flagpole added to the breakout point.
In contrast, the rising wedge shows a continuous narrowing of price action with declining volume throughout its formation, culminating in a bearish breakdown rather than a bullish continuation. Understanding this distinction helps traders avoid confusing these two patterns and making incorrect trading decisions.
How to use a rising expanding wedge pattern in crypto trading
The rising expanding wedge pattern offers traders valuable opportunities to protect their portfolios and potentially profit from anticipated price declines. Given its bearish implications, traders employ various strategies when this pattern appears on cryptocurrency charts.
Conservative traders often use rising expanding wedge patterns as exit signals, closing existing long positions before the anticipated breakdown occurs to preserve capital and avoid losses. More aggressive traders may seek to profit from the expected downward movement by establishing short positions through various methods, including direct short selling, purchasing put options, or opening short perpetual futures contracts on centralized trading platforms.
Timing entry into bearish positions requires careful attention to confirmation signals. Traders typically wait for the cryptocurrency's price to break definitively below the support line, accompanied by higher-than-average trading volume, before entering short positions. This volume confirmation validates the rising expanding wedge pattern and increases the probability of a sustained downward movement. For instance, if Ethereum breaks below a rising wedge support line with volume significantly higher than recent averages, this provides stronger confirmation than a low-volume breakdown.
To establish profit targets for short positions, traders commonly employ a measurement technique based on the rising expanding wedge pattern's dimensions. They calculate the vertical distance between the pattern's lowest and highest prices, then subtract this measurement from the highest price point to estimate a potential downside target. While this technique doesn't guarantee the price will reach these levels, it provides a reasonable framework for profit-taking decisions and position management.
Risk management remains critical when trading rising expanding wedge patterns, as false breakouts can occur despite seemingly clear technical signals. Prudent traders incorporate multiple confirmation indicators, analyzing both fundamental factors and complementary technical patterns to validate their bearish thesis before committing capital. Additionally, implementing stop-loss orders above the pattern's highest price point helps limit potential losses if the pattern fails to resolve as expected. These protective orders automatically execute when prices move against the position, allowing traders to exit quickly and preserve capital for future opportunities.
Conclusion
The rising expanding wedge pattern serves as a crucial tool in the cryptocurrency trader's technical analysis arsenal, offering valuable insights into potential trend reversals and helping distinguish between sustainable rallies and temporary price pumps driven by insufficient market demand. Despite its deceptively bullish appearance with continuously rising prices, the pattern's characteristic features—including narrowing price action and declining volume—signal underlying weakness that frequently precedes significant price declines.
Successful application of rising expanding wedge analysis requires traders to understand its key distinguishing features, including the steeper support line relative to resistance, decreasing trading volumes, and its fundamental difference from similar-looking but bullish patterns like the bull flag. By recognizing these characteristics and waiting for proper confirmation signals such as volume-supported breakdowns below support, traders can protect existing positions and potentially profit from anticipated downward movements.
However, traders must remember that technical patterns, including rising expanding wedges, are not infallible predictors of future price action. The cryptocurrency market's inherent volatility and susceptibility to unexpected events mean that even well-established patterns can produce false signals. Therefore, combining rising expanding wedge analysis with comprehensive fundamental research, multiple technical indicators, and rigorous risk management practices—including strategic stop-loss placement—creates a more robust trading approach that can navigate both successful pattern resolutions and occasional false breakouts. By maintaining disciplined analysis and prudent position management, traders can effectively incorporate the rising expanding wedge pattern into their overall cryptocurrency trading strategy.
FAQ
Is a rising wedge expanding bullish or bearish?
A rising wedge pattern is bearish, indicating a potential price decline after breaking below the lower trend line. This pattern typically signals a reversal from the current uptrend.
What is the upward broadening wedge pattern?
The upward broadening wedge is a chart pattern with two expanding trendlines converging upward, indicating potential downward price movement. Price swings between widening upper and lower trendlines, suggesting increased volatility and a likely reversal downward.
Are broadening formations bullish or bearish?
Broadening formations can be either. Broadening tops at market peaks are typically bearish with pullback potential, while broadening bottoms in downtrends often signal bullish reversals and trend changes.
What is the success rate of rising wedges?
Rising wedges typically have a success rate of 70-80% when used correctly. As a bearish reversal pattern, they signal potential downside moves. Combine with other technical indicators to enhance accuracy and confirmation before trading decisions.

Understanding Dollar Cost Averaging: A Guide for Investors

Step-by-Step Bitcoin Wrapping Tutorial

Understanding Dollar Cost Averaging in Cryptocurrency Investments
Understanding the Bitcoin Wrapping Process: A Step-by-Step Guide

How to Unwrap Wrapped Bitcoin Safely and Efficiently

# How Does Chainlink (LINK) Price Volatility Compare to Bitcoin and Ethereum in 2025?

What Is the Best Time for Crypto Trading in India? A Complete Guide

How does WEMIX compare to competing blockchain platforms in market share and transaction fees?

How do macroeconomic factors and Fed policy impact cryptocurrency prices in 2026?

What is Cryptocurrency Compliance and Regulatory Risk: A Complete Guide to SEC Regulations, Audit Transparency, and KYC/AML Policies

What is WeFi (WFI) market overview: price, market cap, trading volume and liquidity in 2026
