LCP_hide_placeholder
fomox
MarketsPerpsSpotSwapMeme Referral
More
Smart Money Recruitment
Search Token/Wallet
/

Price Action

2026-01-20 22:01:37
Crypto Trading
Crypto Tutorial
Spot Trading
Trading Bots
Avaliação do artigo : 4
21 avaliações
This comprehensive guide explores price action trading, a fundamental approach to analyzing financial markets across stocks, forex, commodities, and cryptocurrencies on Gate and other platforms. Price action trading analyzes raw price movements and chart patterns to identify market trends without relying solely on technical indicators, empowering traders to read market sentiment through candlestick formations and support/resistance levels. The guide covers core principles including pattern recognition, market structure analysis, and the debate between pure price action and indicator-combined strategies. Key sections examine Japanese candlestick charts, common reversal and continuation patterns, and practical identification techniques for entry and exit points. Whether you're a beginner seeking foundational knowledge or an experienced trader refining your strategy, this resource provides actionable insights on candlestick patterns, volume analysis, and risk management to enhance your trading decisions and adap
Price Action

What is Price Action?

Price action refers to the price movements of an asset over time as plotted on a chart. It forms the foundation of all technical analysis, regardless of the market being analyzed—whether commodities, stocks, bonds, forex, or cryptocurrency. Price action represents the raw data of market behavior, capturing the collective decisions of all market participants through price fluctuations.

The concept of price action is deceptively simple yet profoundly powerful. Every price movement tells a story about supply and demand dynamics, market sentiment, and the balance between buyers and sellers. By studying these movements, traders can gain insights into potential future price directions without necessarily relying on external indicators or fundamental analysis.

Core Principles of Price Action Trading

Price action traders rely heavily on analyzing the price movements of a financial instrument to create trade ideas. This approach is based on the belief that all relevant market information is already reflected in the price itself. Many short-term price action traders exclusively use price action to identify trade setups, eschewing traditional indicators entirely.

The philosophy behind pure price action trading is that price movements create recognizable patterns and structures that tend to repeat over time. Traders who master the art of reading these patterns can anticipate market movements with greater accuracy. This methodology emphasizes understanding market structure, identifying key support and resistance levels, and recognizing trend formations.

However, it's important to note that many traders adopt a hybrid approach, combining price action analysis with technical indicators to support their trading decisions. The rationale behind this combination strategy is that price action analysis paired with technical indicators may provide more reliable and confirmed trading signals, reducing the likelihood of false entries.

Tools for Price Action Analysis

Price action can be analyzed using various charting tools and chart settings, each offering unique advantages for different trading styles. The most common charting methods include:

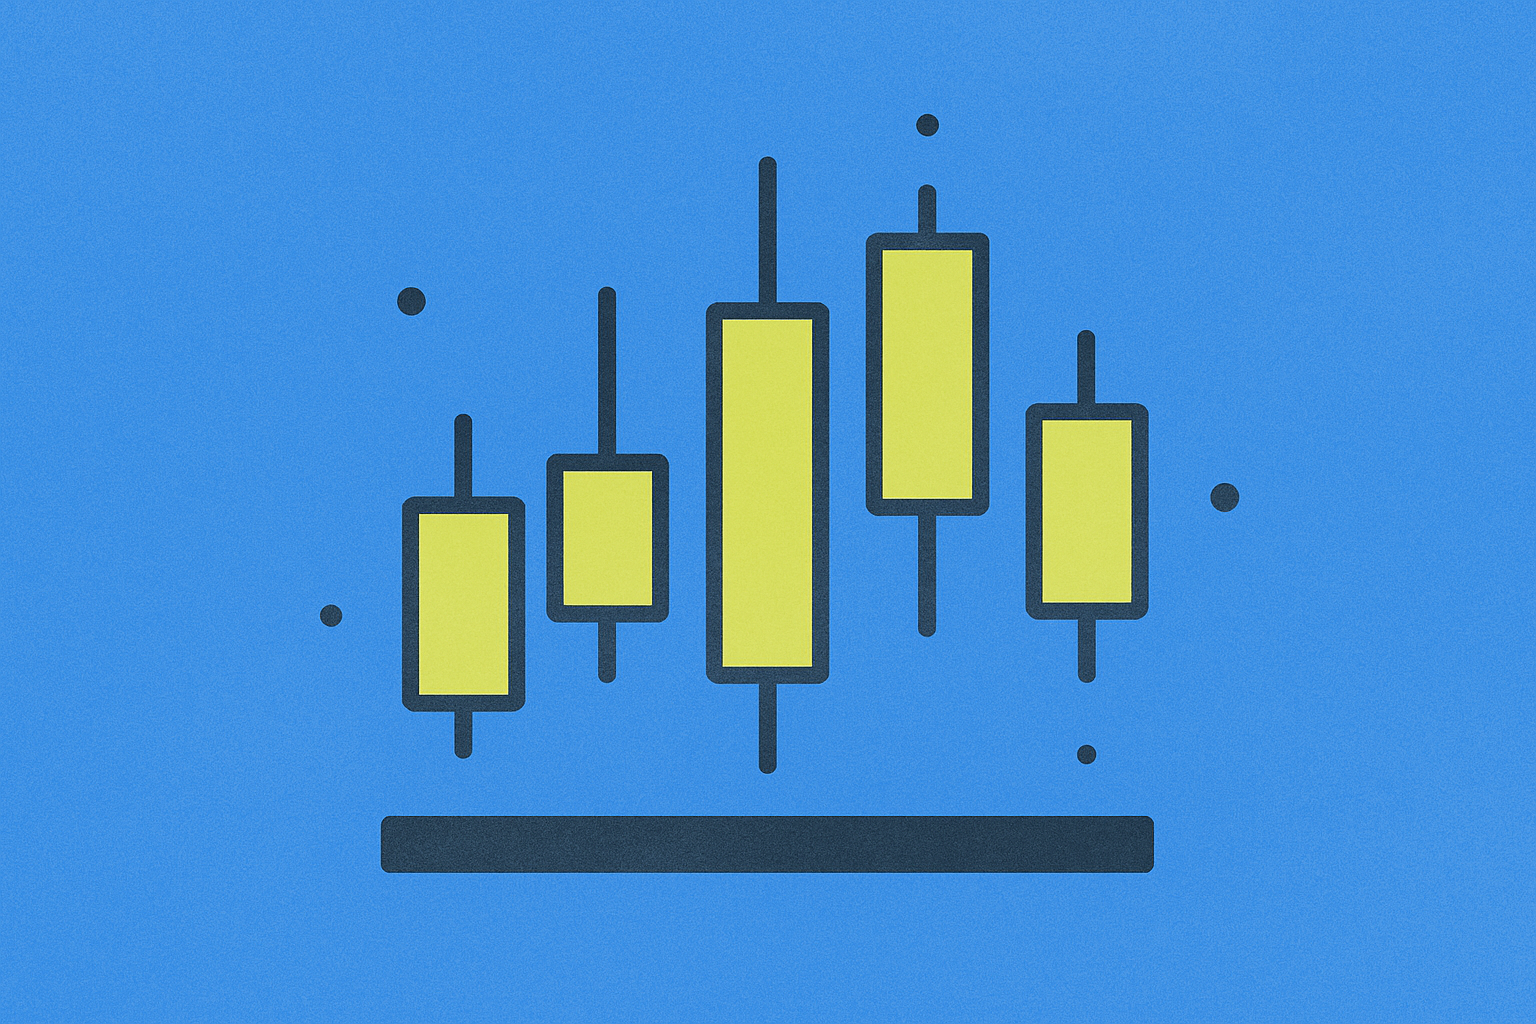
Japanese Candlestick Charts: These are the most popular among price action traders due to their ability to display opening, closing, high, and low prices within a single visual element. Candlesticks provide rich information about market sentiment and momentum within each time period.

Line Charts: These offer a simplified view by connecting only closing prices, making it easier to identify overall trends without the noise of intrabar price movements. Line charts are particularly useful for identifying major support and resistance levels.

Bar Charts: Similar to candlesticks but with a different visual representation, bar charts display the same four price points (open, high, low, close) and are favored by some traders for their clean appearance.

Each of these chart settings illustrates price action in different ways, and traders use them to better identify and interpret market trends. The choice of which charting method to use for price action analysis ultimately comes down to personal preference and trading style. Some traders may switch between different chart types depending on the market conditions or the timeframe they are analyzing.

Price Action vs Technical Indicators

While price action forms the basis of technical analysis, it's worth understanding the relationship between pure price action trading and indicator-based trading. Price action traders argue that indicators are derivative—they are calculated from price data and therefore lag behind actual price movements. By focusing directly on price, traders can potentially identify opportunities earlier.

Technical indicators, on the other hand, can help filter out market noise and provide objective entry and exit signals. Indicators like moving averages, RSI, or MACD can confirm what price action is suggesting, adding an extra layer of confidence to trading decisions.

The debate between pure price action trading and indicator-based trading is ongoing in the trading community. In reality, both approaches have merit, and many successful traders find value in combining elements of both methodologies. The key is to develop a consistent approach that aligns with your trading personality and risk tolerance.

Candlestick Patterns in Price Action Trading

Candlestick patterns are an essential component of price action trading. These chart patterns are essentially recurring formations in price action that traders can identify and use to create actionable trade ideas. The power of candlestick patterns lies in their ability to visually represent market psychology and potential turning points.

The fundamental idea behind candlestick pattern trading is that these formations tend to play out in similar ways across different markets and timeframes. When traders identify a recognized pattern, they can anticipate potential price movements based on historical probability. This gives trade ideas created based on these patterns a potentially high probability of success.

Common candlestick patterns include reversal patterns like hammers, shooting stars, and engulfing patterns, as well as continuation patterns like flags and pennants. Each pattern tells a specific story about the battle between buyers and sellers, and experienced traders learn to read these signals to time their entries and exits more effectively.

Mastering candlestick patterns requires both theoretical knowledge and practical experience. Traders should study these patterns extensively, understand the market psychology behind them, and practice identifying them in real market conditions before incorporating them into their trading strategy.

FAQ

What is Price Action Trading? What are its core principles?

Price Action Trading analyzes historical price movements and trading volume to identify market trends and entry points. Its core principle is reading chart patterns, support/resistance levels, and volume data to make trading decisions without relying on technical indicators.

How to identify support and resistance levels through Price Action?

Identify support by observing where price repeatedly bounces upward, shown by higher lows and increased trading volume. Recognize resistance where price fails to break above, marked by lower highs. Combine candlestick patterns, trend lines, and volume analysis for confirmation of these key levels.

What is the difference between Price Action trading and technical indicator trading?

Price Action trading relies on price movement and chart patterns directly, while technical indicator trading uses mathematical calculations like moving averages and RSI. Price Action offers faster signals and fewer false breakouts, making it more responsive to real market dynamics.

Common Price Action patterns and how to identify and trade them?

Key patterns include Support/Resistance, Breakouts, Pullbacks, Double Tops/Bottoms, and Triangles. Identify by analyzing price movement and volume. Trade by entering on breakouts, using support/resistance as entry/exit levels, and confirming with volume surges for stronger signals.

How to apply Price Action strategy in actual trading?

Identify key support and resistance levels, watch candlestick patterns like breakouts and reversals, analyze trading volume changes, and enter positions when price confirms your signals. Combine multiple patterns for stronger confirmation and manage stops at logical price levels.

What are the advantages and risks of Price Action trading?

Advantages: reads market structure directly, requires no indicators, adapts to all conditions. Risks: demands experience, emotional discipline required, subjective interpretation can cause losses.

* As informações não pretendem ser e não constituem aconselhamento financeiro ou qualquer outra recomendação de qualquer tipo oferecida ou endossada pela Gate.

Compartilhar

Conteúdo

What is Price Action?

Core Principles of Price Action Trading

Tools for Price Action Analysis

Price Action vs Technical Indicators

Candlestick Patterns in Price Action Trading

FAQ

Artigos Relacionados
Decoding the KDJ Indicator: A Comprehensive Guide

Decoding the KDJ Indicator: A Comprehensive Guide

"Decoding the KDJ Indicator" is a comprehensive guide for traders and analysts, focusing on the KDJ as a short-term analysis tool in financial markets. It explains the indicator's components: K-line, D-line, and J-line, and their roles in identifying overbought and oversold conditions. The article highlights key usage rules and signals like Golden and Death Crosses, and divergence detection. It also discusses the practical application of KDJ in day trading and crypto markets, guiding readers on decision-making with it and addressing FAQs for deeper understanding. Suitable for traders seeking clearer insights into price movements and market sentiment.
2025-11-26 09:10:48
How to Interpret MACD and RSI Signals for Cryptocurrency Trading?

How to Interpret MACD and RSI Signals for Cryptocurrency Trading?

This article offers a comprehensive guide to interpreting MACD and RSI signals, essential for optimizing cryptocurrency trading strategies. It explores the fundamentals of these indicators and their application in analyzing trends and momentum. The piece addresses the challenges of false signals by integrating volume analysis, providing a robust trading framework. Targeted at traders, especially those in Gate, the article enhances decision-making by combining technical indicators and market data effectively. Keywords such as MACD, RSI, and volume are emphasized for readability and quick understanding.
2025-12-04 03:56:42
Understanding Cross Trade: Definition and Insights

Understanding Cross Trade: Definition and Insights

In this article, we explore cross trading in the cryptocurrency realm, focusing on its mechanism and market implications. Cross trading allows brokers to match buy and sell orders privately, offering efficiency, maintaining price stability, and presenting arbitrage opportunities. However, it does carry risks like transparency issues and potential market manipulation. Ideal for traders and industry regulators, this guide distinguishes cross trades from block and wash trades, emphasizing responsible usage. Suitable for a quick scan, the piece clarifies crucial concepts through well-structured insights. Keywords: cross trading, cryptocurrency, market dynamics, transparency.
2025-11-29 04:19:50
Understanding Take-Profit in Cryptocurrency Trading

Understanding Take-Profit in Cryptocurrency Trading

Mastering take profit in crypto trading is essential for effective risk management and strategic optimization. Discover how to configure take profit and stop loss orders on Gate to automate your transactions and enhance overall trading results.
2025-12-05 08:45:01
Effective Risk Management: Take Profit and Stop Loss Strategies in Trading

Effective Risk Management: Take Profit and Stop Loss Strategies in Trading

Discover how to use take profit and stop loss orders to manage risk effectively in crypto trading. Explore strategies for order placement and how to apply them to protect your capital on the Gate platform.
2025-12-03 13:56:50
What does "take profit" mean in trading?

What does "take profit" mean in trading?

Discover the concept of take profit in crypto trading and how to use it effectively to manage risk. Review key strategies for setting take profit targets and understand the benefits of integrating them with the Gate platform to maximize your trading performance.
2025-11-30 09:08:53
Recomendado para você
How to Get $20 Fast: Tips and Tricks

How to Get $20 Fast: Tips and Tricks

Discover six practical methods to earn $20 quickly through cryptocurrency, blockchain, and traditional online opportunities. This comprehensive guide explores accessible strategies including participating in airdrops, completing microtasks on Gate and other platforms, joining bounty campaigns, selling unused items, offering freelance services, and taking online surveys. Each method is evaluated for feasibility, earning potential, and time requirements, making it ideal for anyone seeking fast income. Whether you prefer passive crypto rewards or active freelancing, this guide provides actionable steps and expert tips to accelerate your progress toward your $20 financial goal efficiently.
2026-01-20 23:20:00
XRP Price Prediction 2030: Can XRP Really Reach $100 in the Next 5 Years?

XRP Price Prediction 2030: Can XRP Really Reach $100 in the Next 5 Years?

This article examines the controversial $100 XRP price target prediction by analyzing the fundamental drivers and market constraints shaping XRP's long-term valuation potential. It explores bullish arguments centered on massive cross-border payments markets, growing institutional adoption, and supply dynamics, while critically examining skeptical perspectives regarding market capitalization requirements and realistic adoption timelines. The analysis evaluates XRP's unique positioning as a payments-focused asset designed for fast, low-cost settlement infrastructure rather than speculative applications. For traders and investors considering XRP exposure, the article emphasizes that platform selection, trading fees, and liquidity on platforms like Gate are crucial for optimizing execution quality and returns. Regardless of whether XRP reaches speculative targets, it remains a core, actively-traded cryptocurrency with distinctive institutional appeal and genuine use cases within the global payments ecosystem. Suc
2026-01-20 23:16:55
Bitcoin Cash Halving 2024: What to Expect

Bitcoin Cash Halving 2024: What to Expect

This comprehensive guide explores Bitcoin Cash halving, a critical monetary policy mechanism occurring at block height 840,000, reducing mining rewards from 6.25 BCH to 3.125 BCH per block. The article covers halving fundamentals, examining the 2017 Bitcoin Cash fork, Proof of Work consensus, and deflationary design capped at 21 million BCH. Historical analysis reveals the 2020 halving reduced rewards to 6.25 BCH, resulting in network hashrate decline and temporary price pullback. The guide analyzes halving's profound ecosystem impacts: miners face profitability pressure but gain efficiency opportunities, transaction fees may increase modestly, and BCH price typically experiences long-term appreciation due to constrained supply. Expert forecasts vary significantly, ranging from conservative $250.60 to bullish $899.04 targets, reflecting cryptocurrency market volatility. Investors gain clarity on mining economics, network security implications, and adoption potential through this detailed halving framework.
2026-01-20 23:11:37
What Is a Bonding Curve in Crypto?

What Is a Bonding Curve in Crypto?

This comprehensive guide explores bonding curves, a fundamental mathematical framework in cryptocurrency that establishes an automated relationship between token supply and price through smart contracts. The article examines how bonding curves work by automatically adjusting token prices as supply changes, benefiting early participants through lower entry prices. It compares multiple curve types—linear curves offer predictable growth, exponential curves reward early adopters aggressively, logarithmic curves provide initial rapid growth that stabilizes, and specialized curves address specific project needs. The guide analyzes pump.fun as a practical case study on Gate, demonstrating how bonding curves create transparent, decentralized token launches with continuous liquidity and algorithmic pricing. While bonding curves don't guarantee complete self-sustainability due to market volatility and external factors, they represent a viable mechanism for managing token economics, distribution, and market functionalit
2026-01-20 23:06:23
Who is Vitalik Buterin? The Complete Guide to Ethereum's Founder

Who is Vitalik Buterin? The Complete Guide to Ethereum's Founder

This article presents a comprehensive overview of Vitalik Buterin's remarkable journey from a gifted teenager to the visionary founder of Ethereum. Born in 1994 in Russia and raised in Canada, Buterin revolutionized blockchain technology by introducing smart contracts and decentralized applications through the Ethereum platform in 2013. The article explores his early influences, including his fascination with Bitcoin at age 17, his exceptional programming achievements, and his groundbreaking work with the Ethereum co-founding team. It details his current $1.04 billion net worth through substantial Ethereum holdings and examines his ambitious vision for simplifying Ethereum's architecture while maintaining its programmability advantages. Additionally, the piece highlights Buterin's significant philanthropic contributions totaling billions to causes including AI safety research, medical longevity, and humanitarian aid. By analyzing his technical innovations, personal philosophy shaped by decentralization princi
2026-01-20 23:02:27
What Is Zero-Knowledge Proof and How Does It Impact Blockchain?

What Is Zero-Knowledge Proof and How Does It Impact Blockchain?

This comprehensive guide explores zero-knowledge proofs (ZKPs), a revolutionary cryptographic technology enabling verification of information truthfulness without revealing underlying data itself. The guide addresses critical blockchain concerns: privacy preservation and transaction scalability for users and developers in cryptocurrency ecosystems. Readers learn how ZKPs work through intuitive examples, then discover advanced implementations including zk-SNARKs for privacy-focused transactions and zk-Rollups for Layer 2 scaling solutions deployed on major blockchains via Gate exchange platforms. The article covers practical use cases spanning digital identity verification, privacy-preserving DeFi transactions on Gate, shielded transactions via Zcash, and regulatory compliance solutions. Technical developments in zk-STARKs and developer toolkits make ZKP technology increasingly accessible, though computational limitations and security assumptions require consideration. This guide positions zero-knowledge proof
2026-01-20 22:28:17