Stochastic RSI: The Definitive Guide for Cryptocurrency Traders

Introduction
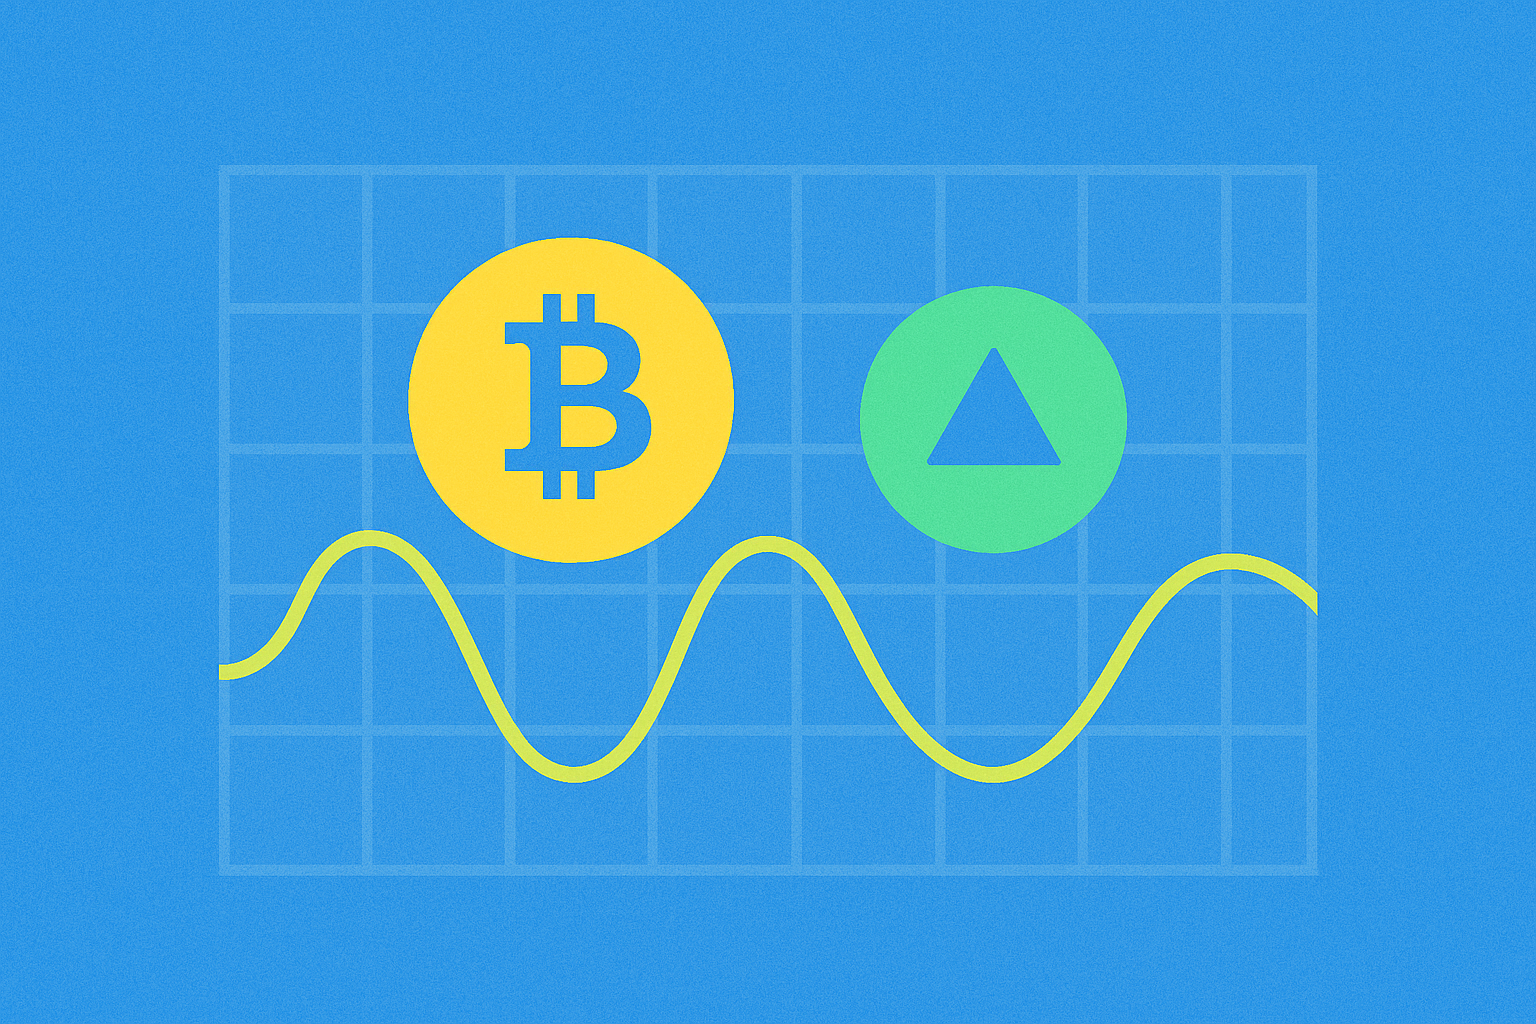
The cryptocurrency market is highly volatile, and traders continuously look for tools to analyze price movements with precision. One of the most effective tools is the Stochastic RSI, a robust technical indicator that helps identify trend reversals, overbought, and oversold zones. Whether you're trading Bitcoin, Ethereum, or other cryptocurrencies, mastering this indicator can give you a competitive advantage.
So what exactly is Stochastic RSI? How does it differ from standard RSI, and how can you apply it in live trading? This guide covers everything you need to know, from its formula and mechanics to practical strategies for traders. Regardless of your experience level, you'll discover how to leverage Stochastic RSI to make informed decisions in the cryptocurrency market.
What Is Stochastic RSI?
Stochastic RSI (StochRSI) is a technical indicator that fuses two popular analysis tools: the Relative Strength Index (RSI) and the Stochastic Oscillator. It's designed to be highly sensitive to price changes, which is especially valuable in the fast-moving crypto market.
While classic RSI assesses trend strength and signals whether an asset is overbought or oversold, Stochastic RSI goes further. It applies the stochastic oscillator formula to RSI values, allowing for more precise detection of short-term shifts. The indicator moves between 0 and 1 (or 0 to 100 percent), with readings above 0.8 (80%) signaling overbought conditions and below 0.2 (20%) signaling oversold conditions.
The formula for Stochastic RSI is:
StochRSI = (RSI - RSI min) / (RSI max - RSI min)
where:
- RSI — current Relative Strength Index value;
- RSI min — lowest RSI value in the selected period;
- RSI max — highest RSI value over the same period.
There’s no need for beginners to calculate manually—most trading platforms, including major crypto exchanges, automatically compute the indicator. The most important thing to know is that StochRSI reacts more quickly to price changes than its "parent" indicators, making it extremely useful for analyzing volatile assets like cryptocurrencies.
How Does Stochastic RSI Work?
Stochastic RSI analyzes the current RSI value in relation to its range over a set period (typically 14 candles). The indicator displays two lines:
- %K — the main line representing the current StochRSI value;
- %D — the signal line, usually a 3-period moving average of %K.
When %K crosses %D upward in the oversold zone (below 20), it can signal the start of an uptrend. A downward cross in the overbought zone (above 80) often points to a potential price decline. Always consider the broader market context when interpreting these signals.
Overbought and oversold zones are critical for traders. For instance, when Bitcoin enters the overbought zone, buyers may be exhausted and a price correction could follow. Conversely, oversold conditions often precede a rebound. Because cryptocurrencies are notoriously unpredictable, StochRSI works best when paired with other indicators.
This indicator also helps spot divergences—situations where the asset price moves in one direction while StochRSI moves in the opposite. For example, if Bitcoin’s price is climbing but StochRSI is dropping, it could be an early warning of a trend reversal.
Stochastic RSI: Pros and Cons
Every tool has its benefits and drawbacks. Here’s a closer look at both sides of Stochastic RSI.
Advantages:
- High sensitivity. StochRSI reacts quickly to price changes, making it ideal for short-term crypto trading.
- Easy to interpret. Overbought and oversold zones are straightforward, even for beginners.
- Versatile. Works across all timeframes, from minutes to daily charts.
Disadvantages:
- False signals. StochRSI can generate inaccurate signals in volatile markets, especially during strong trends.
- Setting dependent. Using periods that are too short or too long can skew results.
- Not effective alone. For reliable predictions, combine with other analysis tools.
Understanding these aspects will help you avoid common mistakes and get the most out of StochRSI.
How to Use Stochastic RSI in Crypto Trading
Now that you know what Stochastic RSI is and how it works, let’s put it into action. The crypto market—with its rapid spikes and drops—is a perfect setting for this indicator. But how do you set it up on your exchange platform, and what strategies are most effective? Here’s a step-by-step guide.
Step 1: Setting Up the Indicator
Most crypto platforms offer built-in technical analysis tools. To add Stochastic RSI:
- Open the chart for your chosen trading pair (e.g., BTC/USDT).
- Go to “Indicators” and select “Stochastic RSI.”
- Set standard parameters: RSI period 14, %K period 14, %D period 3, smoothing 3. These work well in most cases, but you can adjust the period based on your timeframe.
For scalping on minute charts, reduce the period to 9 for increased sensitivity. For long-term trading on daily charts, increase the period to 21 to smooth out noise.
Step 2: Interpreting Signals
Stochastic RSI generates several signal types for trade entries and exits:
- Line crossovers. When %K crosses %D upward below 20, it signals a buy. When %K crosses downward above 80, it signals a sell.
- Divergences. If Ethereum’s price reaches new highs but StochRSI peaks are falling, a downward reversal may be ahead.
- Central line breakout (0.5). %K above 0.5 confirms a bullish trend; below 0.5, a bearish trend.
Example: Practical Application
Suppose you’re trading Bitcoin on an hourly chart. After a sharp price drop, StochRSI falls below 20 and then %K crosses %D upward. That's a buy signal—the price is likely to recover soon. You open a long position and close it when the indicator reaches 80 and the price has made a significant gain. This strategy helps you capture profits in upward moves.
Step 3: Combining with Other Tools
Stochastic RSI is rarely used in isolation, especially in crypto. Here are ways to strengthen your analysis:
- Moving averages (MA). Use 50- and 200-period MAs to determine the overall trend. If StochRSI gives a buy signal but price is below the 200 MA, it’s better to wait—the trend may be down.
- Support and resistance levels. Confirm StochRSI signals by checking price proximity to key levels. Oversold at strong support is an ideal entry point.
- Volume. Increased volume when StochRSI breaks out of the oversold zone strengthens the signal.
Pro Tip
Test StochRSI on your platform’s demo account. Start with short timeframes (5–15 minutes) and gradually move to longer ones to learn how the indicator performs under different market conditions. This will help you build a strategy tailored to crypto volatility.
Beginner Tips: Avoiding Common Mistakes
Stochastic RSI is powerful, but beginners often make costly errors. Here are practical tips to reduce risk and improve your trading outcomes.
1. Don’t trade signals blindly
Cryptocurrencies like Bitcoin and altcoins can stay overbought or oversold much longer than traditional assets. If StochRSI reads 90, the price may not drop immediately. Always consider the news, overall trend, and major player activity.
2. Avoid overtrading
StochRSI’s sensitivity can tempt you to trade every signal. In volatile markets, this often leads to false signals and losses. Establish strict entry and exit rules, such as trading only at confirmed price levels.
3. Adapt to volatility
The crypto market is unpredictable: sudden news or big player moves can override any signal. If markets are noisy (e.g., after major news), shorten the timeframe or pause StochRSI trading in favor of simpler tools like Fibonacci levels.
4. Practice risk management
No StochRSI signal is foolproof. Set stop-losses 1–2% below your entry and never risk more than 1–2% of your account per trade. This is crucial in crypto, where price swings can be severe within minutes.
5. Experiment with settings
Standard parameters (14, 14, 3) aren’t universal. For highly volatile altcoins, try reducing the period to 9 or 10. For stablecoins paired with BTC, increase the period to 20 to filter out market noise.
By following these tips, you’ll avoid common pitfalls and make StochRSI a dependable tool for your trading decisions.
Conclusion
Stochastic RSI isn’t just another indicator—it’s a powerful tool for analyzing the cryptocurrency market. It combines the speed of the stochastic oscillator with the accuracy of RSI, helping you pinpoint entry and exit points even during chaotic price swings. From overbought and oversold levels to divergence signals, StochRSI provides clear, actionable insights.
As with any tool, success depends on skillful use. Pair StochRSI with other indicators, account for crypto volatility, and always practice risk management. Used correctly, Stochastic RSI can become a cornerstone of your trading system and empower you to make better decisions in the crypto market.
FAQ
What are the optimal settings for Stochastic RSI?
The best settings for Stochastic RSI are: period 14, K smoothing 3, D smoothing 3. These values balance sensitivity and signal reliability. Set overbought at 80 and oversold at 20 to catch trend reversals.
Which RSI setting works best for crypto?
For crypto, a 14-period RSI is ideal, but adjust for volatility when needed. Stochastic RSI (14,14,3,3) filters out noise and identifies reversals on short- and medium-term timeframes. Use with support/resistance for greater accuracy.
Which RSI should you use?
Stochastic RSI is superior to traditional RSI for identifying extremes and turning points in crypto markets. It’s more responsive and catches early entry and exit signals, especially for volatile coins. Trade using readings above 80 and below 20.
How is RSI different from Stochastic RSI?
RSI measures price strength by tracking the magnitude of changes. Stochastic RSI applies the stochastic formula to RSI itself, revealing overbought and oversold conditions within the RSI range. This makes Stochastic RSI faster and more sensitive to trend shifts.
How do you interpret Stochastic RSI signals for entry and exit?
Stochastic RSI signals appear when %K and %D lines cross. Enter long below 20 (oversold), exit or go short above 80 (overbought). Confirm signals with chart patterns and support/resistance levels for higher accuracy.
What overbought and oversold levels should be used for Stochastic RSI?
The standard thresholds are 80 for overbought and 20 for oversold. These help you spot potential market turning points. Some traders prefer more extreme values—90 and 10—for more conservative entries.
What timeframes are most effective for Stochastic RSI trading?
Stochastic RSI works best on medium-term timeframes: 4-hour and daily charts. For day trading, use 15-minute or hourly intervals. On weekly charts, the indicator gives more reliable signals for long-term trades.
How do you combine Stochastic RSI with other technical indicators?
Pair Stochastic RSI with MACD to confirm momentum, use moving averages to define trends, and support/resistance levels for trade entries. Combine with volume to validate reversal signals. This approach improves price prediction accuracy.

Trading Strategies: Understanding the Bull Flag Pattern in Crypto

Mastering RSI: Essential Guide to Using Relative Strength Index in Digital Asset Trading

Decoding the KDJ Indicator: A Comprehensive Guide

How to Interpret MACD and RSI Signals for Cryptocurrency Trading?

Understanding Take-Profit in Cryptocurrency Trading
Mastering Bitcoin Trading with Pivot Points: Strategies and Techniques

What Is the Best Time for Crypto Trading in India? A Complete Guide

How does WEMIX compare to competing blockchain platforms in market share and transaction fees?

How do macroeconomic factors and Fed policy impact cryptocurrency prices in 2026?

What is Cryptocurrency Compliance and Regulatory Risk: A Complete Guide to SEC Regulations, Audit Transparency, and KYC/AML Policies

What is WeFi (WFI) market overview: price, market cap, trading volume and liquidity in 2026
