What are the key derivatives market signals to watch in crypto trading: futures open interest, funding rates, and liquidation data explained
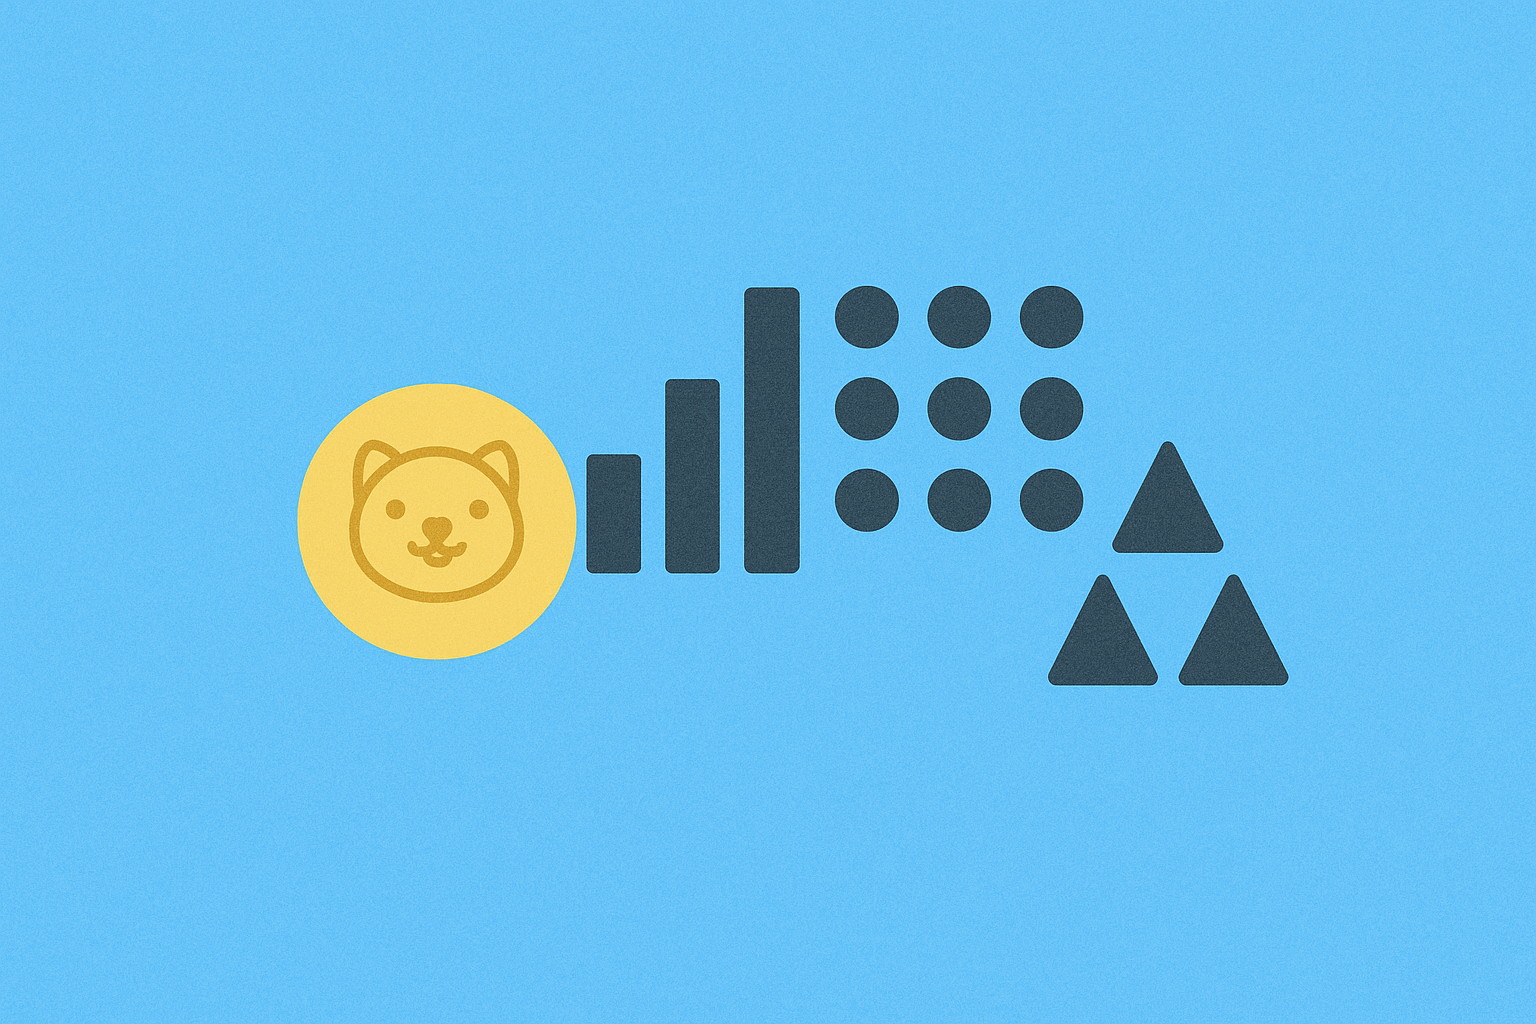
Futures Open Interest Surge: Baby Doge's 44% Jump Signals Strengthening Bullish Conviction
Baby Doge's futures open interest experienced a remarkable 44% surge, reflecting intensifying bullish sentiment within the derivatives market. This substantial jump in open interest signals that traders are accumulating long positions with considerable confidence, indicating strengthening conviction among market participants. The climb to nearly $2 billion in futures open interest demonstrates significant capital allocation toward Baby Doge derivative contracts, suggesting elevated speculative trading activity and retail participation in meme-coin futures markets. When futures open interest increases dramatically, it typically indicates that traders expect sustained price momentum and are willing to commit capital to derivatives positions. This metric serves as a critical derivatives market signal because it reveals genuine market sentiment beyond spot price movements. The $2 billion level represents substantial commitment from both institutional and retail traders positioning for potential upside moves. Rising open interest coupled with bullish positioning suggests traders are not merely making quick trades but establishing meaningful derivative positions. This concentration of bullish conviction in Baby Doge's futures market demonstrates how meme-coins continue attracting significant speculative interest, particularly through leveraged trading channels where open interest metrics become invaluable indicators for assessing true market participation levels and conviction strength.
Funding Rates and Long-Short Dynamics: Reading Market Sentiment Through Derivative Metrics
Funding rates represent the periodic payments exchanged between long and short traders on perpetual futures contracts, functioning as a powerful window into prevailing market psychology. When funding rates turn positive and elevated, longs are paying shorts—a signal that bullish sentiment has driven excessive leverage into the market. Conversely, negative funding rates indicate bearish positioning dominance, with shorts compensating longs. These derivative metrics reveal whether traders collectively expect price appreciation or depreciation, making them essential for risk-conscious market participants.
The long-short ratio complements funding rate analysis by quantifying the proportion of open positions held by bulls versus bears. Rising long-short ratios accompanying positive funding often suggest overheated bullish conviction, potentially indicating a market near reversal points. This dynamic becomes particularly valuable when combined with funding rate extremes—extremely high positive rates paired with elevated long ratios frequently precede corrective liquidation cascades. Professional traders monitor these combinations to identify leverage extremes and timing opportunities.
Reading market sentiment through these derivative signals requires understanding trader behavior patterns. When funding rates spike sharply, retail traders typically chase momentum, amplifying leverage precisely when risk management should tighten. Sophisticated participants use these moments to identify potential reversal zones where long liquidations could accelerate downside momentum. The long-short dynamics thereby serve as both a confirmation of existing sentiment and a predictive tool for identifying unsustainable positioning before major moves occur.
Liquidation Patterns and Risk Assessment: How to Identify Market Extremes Using On-Chain Data
On-chain liquidation data serves as a critical barometer for identifying market extremes in derivatives trading. When liquidation patterns spike sharply, they signal that leveraged positions are being forcibly closed, indicating trader capitulation or euphoria depending on directional context. Experienced traders monitor these metrics across major protocols to detect when markets approach critical inflection points.
Effective risk assessment requires analyzing on-chain data beyond simple liquidation volume. Position concentration across addresses reveals systemic vulnerability—when a significant portion of open interest concentrates in a few leveraged positions, market extremes become more pronounced and sudden. Traders examine cross-protocol leverage exposure to understand how interconnected risk is distributed, as cascading liquidations in one protocol can trigger secondary waves elsewhere.
The relationship between funding rates and liquidation activity provides additional confirmation of market sentiment. Elevated funding rates preceding liquidation spikes suggest traders were overextended before being shaken out. By tracking these correlating signals together—liquidation magnitude, position concentration, and funding dynamics—traders can more confidently identify whether markets have reached genuine extremes or merely temporary oversolds. This multi-layered approach to analyzing on-chain liquidation data transforms raw blockchain metrics into actionable intelligence for timing entry and exit points during high-volatility periods.
Options Open Interest Concentration: Strategic Positioning at Key Strike Prices
When analyzing derivatives markets, options open interest concentration at specific strike prices reveals critical information about trader expectations and market positioning. This concentration pattern indicates where the largest number of option contracts are clustered, typically reflecting where traders anticipate significant price action may occur. High concentration at particular strike prices demonstrates institutional and retail trader alignment on key price levels, serving as a powerful indicator of market sentiment.
The clustering of options open interest around certain strike prices, such as the $0.00001 level observed in some altcoin markets, signals strong positioning consensus. These concentrated strike prices often act as psychological and technical barriers that traders monitor closely. When substantial open interest congregates at specific levels, it frequently precedes periods of increased volatility, as price movement toward these strikes can trigger cascading liquidations and additional positioning adjustments. Traders strategically place their options contracts at strike prices that align with their directional bias and risk tolerance, making concentration patterns invaluable for interpreting collective market psychology and anticipated trading ranges.
FAQ
What is futures open interest (OI) and how does it reflect bullish or bearish market sentiment?
Futures open interest represents the total number of active contracts. Rising OI signals strengthening bullish sentiment as new positions accumulate, while declining OI indicates weakening interest. High OI suggests market conviction and potential significant price moves when sentiment reverses.
What is Funding Rate (Funding Rate) and how to judge whether the market is over-leveraged through it?
Funding rate reflects market sentiment and long-short dynamics. Extreme positive rates indicate excessive optimism suggesting overbought conditions, while extreme negative rates signal panic and potential over-leveraging. Monitor these extremes as reversal signals.
What predictive significance does liquidation data have for cryptocurrency price trends?
Liquidation data reveals deleveraging in derivatives markets, signaling potential short-term price declines and reduced liquidity. High liquidation volumes typically indicate increased market pressure and volatility ahead.
How to simultaneously use open interest, funding rates, and liquidation data to develop trading strategies?
Monitor open interest trends to gauge market sentiment, track funding rates for cost indicators, and analyze liquidation clusters for key price levels. High open interest combined with positive funding rates suggests bullish pressure, while liquidation concentrations reveal potential reversal zones for entry and exit optimization.
What are common pitfalls and risks when using these derivatives market signals?
Common risks include signal lag, leverage amplification, liquidation cascades, false signals during low liquidity, funding rate manipulation, and over-reliance on single metrics. Market volatility can trigger rapid liquidations. Always validate signals across multiple indicators and manage position size carefully.

What Does On-Chain Data Analysis Reveal About PEPE: Active Addresses, Transaction Volume, and Whale Distribution in 2026?

How Do PEPE's Derivative Market Signals Predict Its Price Trend in 2025?

How do futures open interest and funding rates signal PENGU price movements?
How Will the 55% Surge in Dash Open Interest Impact the Crypto Derivatives Market?

How Does XPL's Net Fund Flow Impact Its Market Sentiment?
How Do Derivative Market Signals Predict PUMP's Price in 2025?

How to Switch Between Different Languages?
Discover the zkSync Ecosystem

Experience Sei: The Next-Generation Layer 1 Blockchain for Digital Asset Exchange

Wizzwoods (WIZZ): What It Is and How to Buy the GameFi Pixel Farming Token

How to Mint TwitterScan NFTs with Multichain Web3 Wallets