fomox
MarketsPerpsSpotSwap
Meme
Referral
More
Search Token/Wallet
/

# What Causes Crypto Price Volatility: Historical Trends, Support & Resistance Levels Explained

2025-12-26 03:40:24
Bitcoin
Crypto Insights
Crypto Trading
Ethereum
Macro Trends
Article Rating : 4
34 ratings
This article explores what causes crypto price volatility, focusing on historical trends, support and resistance levels, and their impact on market movements. It analyzes Bitcoin and Canton Network's 2025 performance, highlighting how institutional influence and macroeconomic factors drive market shifts. Technical analysis is used to identify key price points, aiding traders in strategic decision-making. Additionally, it examines recent price movements and volatility indicators, providing insights for investors on managing risks and seizing opportunities. This content is valuable for traders, investors, and analysts seeking to understand and navigate the cryptocurrency market's complexities.
# What Causes Crypto Price Volatility: Historical Trends, Support & Resistance Levels Explained

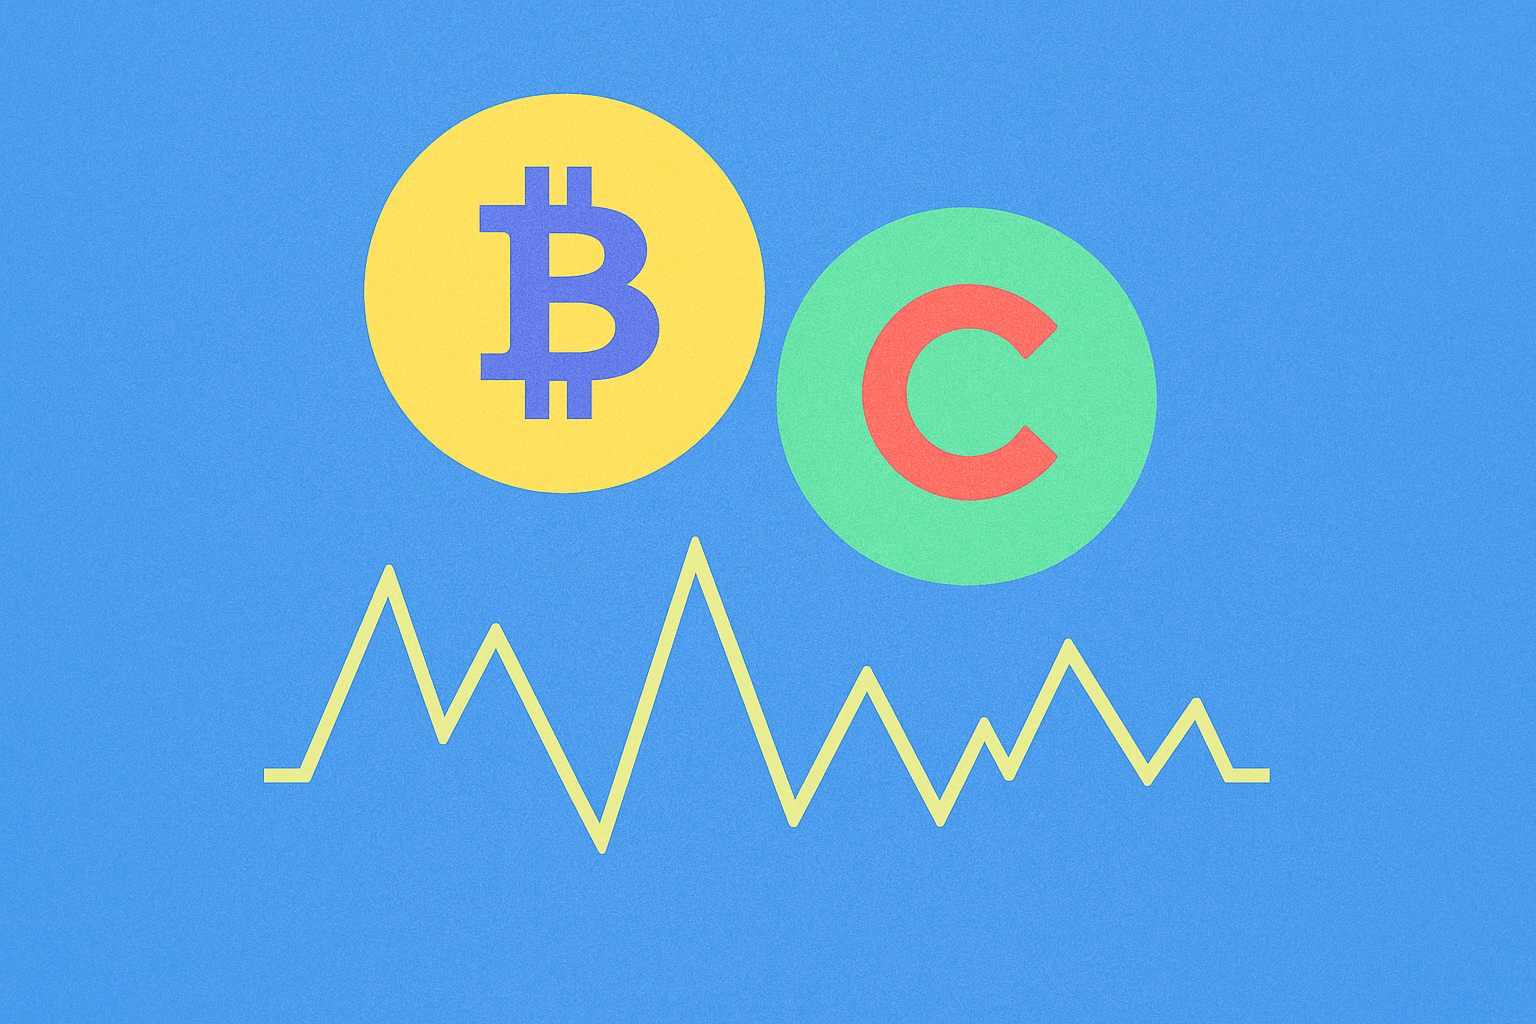
The cryptocurrency market in 2025 demonstrated substantial volatility alongside impressive long-term gains, reflecting the maturation of digital assets and the increasing influence of macroeconomic factors. Bitcoin's price trajectory illustrates this dynamic pattern, rising approximately 80% throughout 2025 despite a significant pullback from its October peak of $126,000 to around $90,000 by year-end. This volatility extended across major tokens and emerging projects alike. Canton Network (CC) experienced even more pronounced fluctuations, declining 66% from its historical high of $0.175 to its December low of $0.05867, highlighting the differential risk profiles across the crypto ecosystem.

Asset 2025 Year Performance Peak Value Current Level Volatility Pattern
Bitcoin +80% YTD $126,000 ~$90,000 Macro-driven corrections
Canton Network (CC) -32.87% YTD $0.175 $0.10211 High institutional sensitivity
Overall Market Cap Peak $4 trillion $4 trillion Declining December pullback phase

These patterns reveal that institutional capital flows, particularly through Bitcoin ETFs, now absorb market corrections without triggering panic-driven exits, fundamentally altering market behavior compared to earlier cryptocurrency cycles. Macroeconomic tremors and evolving regulatory frameworks have transformed cryptocurrencies from speculative assets into macro-correlated instruments, establishing structural adoption as the primary driver of long-term appreciation rather than cyclical hype.

Support and Resistance Levels: Technical Analysis Framework for Identifying Key Price Points

Support and resistance levels represent critical price points where assets tend to reverse or consolidate, forming the foundation of technical analysis for traders worldwide. These levels emerge from historical price action, volume patterns, and mathematical relationships that repeat across multiple asset classes and timeframes. Identifying these zones accurately enables traders to make informed decisions about entry and exit points while managing risk effectively.

Technical analysts employ several methodologies to pinpoint these key price points. Moving averages serve as dynamic support and resistance, smoothing price data to reveal underlying trends. Fibonacci retracements apply mathematical ratios derived from the golden ratio to identify likely reversal zones between significant highs and lows. Volume-weighted average price (VWAP) combines price and volume information, showing where institutional activity concentrates. For instance, Canton Network (CC) exhibits support at $9.13 with resistance near $11.70, while Fibonacci extension suggests a potential level at $6.65. Similarly, Bitcoin demonstrates support clustering around $80,000 to $81,000, with resistance positioned between $90,000 and $91,300 as of late 2025.

Asset Support Level Resistance Level Fibonacci Extension
CC Stock $9.13 $11.70 $6.65
Bitcoin $80,000 $90,000 Not specified
Ethereum $2,680+ $3,000 Not specified

Breakout detection algorithms monitor when prices penetrate these levels, signaling potential trend changes or momentum acceleration. Traders validate breakouts by confirming volume increases and eliminating false signals through filtering mechanisms. Risk management through position sizing protects capital when support levels fail, ensuring losses remain proportional to account size and predetermined risk parameters.

Recent Price Movements and Correlation Analysis with Bitcoin and Ethereum

Canton Network experienced significant price volatility throughout 2025, with notable fluctuations reflecting broader market dynamics and institutional adoption trends. The token reached its all-time high of $0.1595 on November 10, 2025, before experiencing a substantial correction to $0.0590 on December 6, 2025. As of December 26, 2025, CC traded at $0.10211, representing a 24-hour decline of 5.02% despite a robust 34.65% recovery over the preceding seven days.

Metric Value Performance
All-Time High $0.1595 November 10, 2025
Recent Low $0.0590 December 6, 2025
Current Price $0.10211 December 26, 2025
24H Change -5.02% Short-term Volatility
7D Change +34.65% Strong Recovery

Unlike Ethereum and Bitcoin, which demonstrated a correlation coefficient of 0.96, CC exhibited distinctive price behavior patterns. This divergence suggests that Canton Network's institutional finance focus and unique value proposition insulate it from synchronized movements observed in broader cryptocurrency markets. The token's independence reflects its specialized positioning within the ecosystem.

Volatility Indicators: Measuring Market Fluctuations Through Historical and Implied Metrics

Volatility indicators serve as critical tools for investors and traders seeking to understand market dynamics and asset price fluctuations. These metrics fall into two primary categories that work in tandem to provide comprehensive market insights.

Historical volatility measures past price movements using statistical analysis of closing prices over specific timeframes. The Canton Network token (CC) demonstrated this principle clearly, with its 30-day historical volatility showing a 12.76% price change as of December 2025. Conversely, implied volatility reflects market expectations of future price movement derived from option pricing models.

Volatility Type Timeframe Application Data Source
Historical (Close-to-Close) 30 days Past performance analysis 0.1563 for KO stock
Implied Volatility (Calls) Near-term Options pricing 0.1526 for KO stock
Implied Volatility (Puts) Near-term Downside protection 0.1402 for KO stock

The VIX index, trading at 15.77 in December 2025, exemplifies how implied volatility captures market sentiment regarding S&P 500 index options. The disparity between historical and implied metrics often signals investor expectations about upcoming market turbulence. When CC token experienced significant volatility with a 34.65% seven-day surge, understanding both historical trends and implied expectations proved essential for position management. This dual-metric approach enables investors to identify potential trading opportunities while assessing risk exposure across various market conditions.

FAQ

What is CC in crypto?

CC stands for Crypto Currency, referring to digital assets secured by cryptography. It represents virtual currencies operating on blockchain networks, enabling decentralized transactions and financial operations in the crypto ecosystem.

How much is the CC token worth?

The CC token is currently worth $4.1140. This price reflects its real-time market value based on the latest trading activity and market conditions.

What is CC coin and what is its purpose?

CC coin is a decentralized digital asset built on blockchain technology designed to enable fast, secure transactions and smart contract functionality. It serves as a utility token within the CC ecosystem, facilitating payments, governance, and incentivizing network participation across the web3 community.

How do I buy and store CC tokens?

Purchase CC tokens through peer-to-peer trading or card payments. Transfer to a secure wallet immediately after purchase. Use offline storage solutions like hardware wallets for maximum security and asset protection.

What are the risks and security considerations for CC coin?

CC coin risks include phishing attacks, malware, and investment scams. Security best practices involve using strong passwords, enabling two-factor authentication, and verifying transaction legitimacy. Always secure your private keys and use reputable wallets.

What is the total supply and market cap of CC coin?

CC coin has a total supply of 945.12M tokens. The circulating supply matches the total supply at 945.12M. Market cap fluctuates based on current token price, calculated by multiplying circulating supply by real-time market value.

* The information is not intended to be and does not constitute financial advice or any other recommendation of any sort offered or endorsed by Gate.

Share

Content

Support and Resistance Levels: Technical Analysis Framework for Identifying Key Price Points

Recent Price Movements and Correlation Analysis with Bitcoin and Ethereum

Volatility Indicators: Measuring Market Fluctuations Through Historical and Implied Metrics

FAQ

Related Articles
2025 Cryptocurrency Bear Market: Duration and Insights

2025 Cryptocurrency Bear Market: Duration and Insights

This article offers a comprehensive exploration of the cryptocurrency bear market, detailing its characteristics, duration, and survival strategies. It clarifies what constitutes a bear market in crypto, contrasts it with bull markets, and pinpoints key indicators to recognize and react to downturns. Targeting investors seeking to navigate turbulent market phases, the piece outlines effective portfolio management techniques and psychological strategies to mitigate fear-driven decisions. Emphasizing historical patterns, it encourages strategic asset accumulation and disciplined risk management as pathways to overcoming bearish conditions and capturing future gains.
2025-12-21 07:13:25
How Does Crypto Price Volatility Affect Bitcoin and Ethereum Trading in 2026?

How Does Crypto Price Volatility Affect Bitcoin and Ethereum Trading in 2026?

# How Does Crypto Price Volatility Affect Bitcoin and Ethereum Trading in 2026? Bitcoin and Ethereum volatility creates distinct trading challenges in 2026, requiring sophisticated risk management strategies. This guide analyzes Bitcoin's resistance levels near $94,253-$100,000 and Ethereum's $2,800-$5,000 projection range, while examining how cross-asset price swings impact liquidity on platforms like Gate. Traders will discover support/resistance zone optimization, machine learning forecasting techniques, and dynamic position-sizing frameworks for navigating extreme price fluctuations. Whether you're managing portfolios during volatile periods or developing algorithmic strategies, this article provides essential volatility metrics, correlation analysis, and practical risk management techniques to profit from crypto market turbulence while protecting capital through data-driven decision-making.
2026-01-02 02:39:21
What Factors Drive Crypto Price Volatility and How to Predict Market Swings in 2025?

What Factors Drive Crypto Price Volatility and How to Predict Market Swings in 2025?

# Article Introduction This comprehensive guide examines the critical factors driving cryptocurrency price volatility in 2025 and provides actionable strategies for predicting market swings. By analyzing historical price trends, support/resistance levels, and volatility metrics like BTC/ETH correlations, traders gain essential tools for navigating crypto markets. The article explores how macroeconomic policies, trading volume, regulatory changes, and on-chain indicators influence altcoin price movements across multiple timeframes. Ideal for traders, investors, and market analysts seeking to understand crypto price dynamics, this guide combines technical analysis frameworks with real market data from Gate trading platforms. Master volatility prediction techniques and identify market bottoms/tops through proven methodologies applicable throughout 2025's crypto landscape.
2025-12-28 02:17:35
What Drives Cryptocurrency Price Volatility: Support, Resistance, and BTC-ETH Correlation Analysis

What Drives Cryptocurrency Price Volatility: Support, Resistance, and BTC-ETH Correlation Analysis

# Article Overview This comprehensive guide examines cryptocurrency price volatility through three interconnected analytical frameworks. It explores how **support and resistance levels** emerge from historical price patterns, analyzes current **volatility metrics** affecting market dynamics, and investigates **BTC-ETH correlation** driving broader market movements. Designed for traders and investors on Gate, the article transforms technical concepts into actionable insights for risk management and position optimization. By connecting historical price trends with real-time market data and correlation analysis, readers gain a complete understanding of cryptocurrency volatility drivers and their practical applications in trading strategies.
2025-12-29 03:34:03
How does Ethereum price volatility compare to Bitcoin in 2026?

How does Ethereum price volatility compare to Bitcoin in 2026?

# How Does Ethereum Price Volatility Compare to Bitcoin in 2026? This comprehensive guide examines Ethereum's elevated price volatility against Bitcoin's stability throughout 2025 and into 2026. Readers will discover how Ethereum's 50% drawdowns and 5-year volatility peaks contrast sharply with Bitcoin's restrained movements, despite strong 0.89 market correlation. The article analyzes technical support-resistance levels ($2,600-$5,000), options market data revealing Ethereum's 70% implied volatility versus Bitcoin's 45%, and the speculative factors driving larger ETH price swings. Institutional investors, retail traders on Gate, and cryptocurrency analysts will gain actionable insights into volatility risk management, on-chain metrics monitoring, and long-term price projections reaching $8,000-$30,000 by 2030, enabling informed portfolio positioning as market maturity shapes asset volatility patterns.
2026-01-03 01:06:27
What Is Crypto Price Volatility and How Does It Impact Bitcoin and Ethereum Trading?

What Is Crypto Price Volatility and How Does It Impact Bitcoin and Ethereum Trading?

# Article Overview: What Is Crypto Price Volatility and How Does It Impact Bitcoin and Ethereum Trading? Cryptocurrency price volatility determines trading outcomes for Bitcoin and Ethereum investors. This comprehensive guide examines how rapid price fluctuations arise from market liquidity constraints, speculative behavior, and instant news propagation across global exchanges. Readers discover support and resistance level identification through historical price analysis, understand BTC/ETH correlation dynamics, and learn volatility metrics across multiple timeframes. Active traders on Gate can leverage this knowledge to optimize entry and exit strategies, while risk managers gain frameworks for position sizing and stop-loss implementation. The article addresses critical trader needs: identifying volatility patterns, analyzing price trends, measuring correlation impacts, and implementing effective risk management techniques for navigating cryptocurrency market uncertainty.
2025-12-28 06:00:50
Recommended for You
What is crypto holdings and capital flow: How to understand exchange inflows, staking rates and institutional positions?

What is crypto holdings and capital flow: How to understand exchange inflows, staking rates and institutional positions?

This comprehensive guide decodes cryptocurrency holdings and capital flows by analyzing three interconnected metrics: exchange inflows/outflows that signal market sentiment and selling pressure, staking rates reflecting protocol security and investor conviction, and institutional position concentration revealing whale behavior and market structure. The article explains how tracking these on-chain indicators across major platforms like Gate reveals real-time liquidity dynamics and capital movement patterns. By monitoring when investors transfer crypto to exchanges versus holding positions off-chain, and examining how institutional holders adjust their positions, readers can interpret market psychology more accurately. The convergence of exchange flows, staking participation, and institutional positioning creates powerful predictive signals for market cycles. Whether you're a trader seeking timing advantages or an analyst understanding institutional sentiment, this framework demonstrates how multi-metric analys
2026-01-12 03:43:30
What is on-chain data analysis and how do active addresses, transaction volume, whale distribution, and network fees predict crypto market movements

What is on-chain data analysis and how do active addresses, transaction volume, whale distribution, and network fees predict crypto market movements

On-chain data analysis provides crypto investors with powerful tools to predict market movements by tracking four critical metrics: active addresses gauge genuine network adoption and participation trends, transaction volume distinguishes accumulation from distribution phases revealing smart money behavior, whale concentration patterns expose market vulnerability and price catalysts through large holder distribution analysis, and network fees indicate congestion and volatility shifts during different market cycles. By monitoring these indicators through blockchain explorers and analytics platforms on Gate and other on-chain data tools, traders can identify emerging trends, timing patterns, and market sentiment changes before they materialize in price charts. This comprehensive framework enables investors to anticipate price movements, identify optimal entry and exit points, and understand whether market dynamics reflect genuine ecosystem demand or whale-driven activity shifts. Understanding these interconnect
2026-01-12 03:42:02
How do Federal Reserve policies and inflation data impact cryptocurrency prices in 2026

How do Federal Reserve policies and inflation data impact cryptocurrency prices in 2026

This article examines how Federal Reserve rate decisions and inflation data directly drive cryptocurrency volatility in 2026. It analyzes the transmission mechanisms through which Fed policy announcements reshape Bitcoin and Ethereum valuations within minutes, explores how CPI releases trigger immediate price reactions across digital assets, and demonstrates the correlation between traditional markets like the S&P 500 and crypto performance. The guide explores real-time response lag patterns, institutional hedging strategies, and macroeconomic sentiment indicators. By tracking Fed communications, inflation metrics, and traditional market divergences through platforms like Gate, investors gain actionable insights for cryptocurrency portfolio positioning. This comprehensive analysis equips traders with frameworks to anticipate price movements during monetary policy shifts and inflation cycles.
2026-01-12 03:40:21
What Do Derivatives Market Signals Tell Us About Future Crypto Price Movements: Futures Open Interest, Funding Rates, and Liquidation Data Analysis

What Do Derivatives Market Signals Tell Us About Future Crypto Price Movements: Futures Open Interest, Funding Rates, and Liquidation Data Analysis

Cryptocurrency derivatives market signals provide critical insights into potential price movements through three interconnected indicators. Futures open interest combined with funding rates reveals overbought and oversold market conditions, where elevated funding rates exceeding 0.1% per period often precede sharp corrections. Long-short positioning imbalances create liquidation cascades that amplify volatility and mark reversal points, particularly evident in extreme market extremes. Options open interest tracks institutional positioning and hedging behavior, revealing where markets expect significant price action. By monitoring these metrics on Gate's derivatives platform—including liquidation clusters, funding rate extremes, and open interest surges—traders can identify market turning points and reduce liquidation risk. Understanding these derivative flows transforms raw data into actionable signals for predicting near-term crypto price movements with greater accuracy.
2026-01-12 03:38:33
What is the difference between competing cryptocurrencies in the same blockchain network by market cap and user adoption in 2026

What is the difference between competing cryptocurrencies in the same blockchain network by market cap and user adoption in 2026

This comprehensive guide analyzes how competing cryptocurrencies differentiate within the same blockchain network through market capitalization and user adoption metrics by 2026. The article examines Bitcoin and Ethereum's dominance hierarchy, Layer-1 competitors like Aptos, and real engagement indicators including transaction volume and active addresses. It reveals that market cap differences often exceed valuation gaps between network coins, reflecting investor confidence disparities. The guide explores three core differentiation factors—performance throughput, fee structures, and ecosystem development—that determine competitive advantages on platforms like Gate. By comparing quantifiable metrics such as trading volume, holder counts, and exchange listings, stakeholders gain clear insights into market share dynamics, growth trends, and how user preferences shift across competing protocols. Understanding these competitive forces enables informed decision-making in the evolving cryptocurrency landscape.
2026-01-12 03:36:53
Hana Network (HANA): Web4 Layer-1 Blockchain Infrastructure

Hana Network (HANA): Web4 Layer-1 Blockchain Infrastructure

Hana Network is an innovative Web4 Layer-1 blockchain built on Cosmos SDK, pioneering hypercasual finance through gamified experiences and privacy-first infrastructure. The platform combines social engagement with accessible cryptocurrency services, featuring zk-SNARKs-enabled cross-chain bridges, Hanafuda gaming with 400,000+ users, and KYC-free on/off-ramp solutions via Hana Gateway. Backed by OrangeDAO, Alliance DAO, and SushiSwap, HANA tokens enable real utility across NFT capsules, livestream tipping, and community rewards. This article explores Hana's technological architecture, token mechanics, practical applications, and strategic partnerships, demonstrating how Web4 infrastructure integrates gaming, social interaction, and decentralized finance to drive mainstream cryptocurrency adoption on Gate and other leading platforms.
2026-01-12 03:36:42