What Do Hollow Candles Mean in Crypto?
Understanding Hollow Candles in Cryptocurrency Trading
Understanding market patterns is crucial in the financial sector, and hollow candles represent a sophisticated yet often misunderstood component of trading charts. For investors and traders in the cryptocurrency sphere, grasping the significance of hollow candles can potentially enhance decision-making processes and improve trading outcomes significantly. Unlike traditional candlestick patterns, hollow candles offer nuanced insights into price movements and market trends, making them invaluable tools for both novice and experienced traders navigating the volatile crypto markets.
In the context of cryptocurrency trading, where price volatility can be extreme and market sentiment shifts rapidly, having reliable technical analysis tools becomes paramount. Hollow candles serve as a bridge between raw price data and actionable trading insights, helping traders filter through market noise to identify genuine trend movements and potential reversal points.
Concept Introduction and Fundamental Principles
Hollow candles, also known as Heikin-Ashi candles, represent a specialized charting technique utilized by traders to visualize market trends and price behavior with enhanced clarity. Unlike typical candlestick patterns that display raw price data, hollow candles present a smoothed and averaged version of price activity, providing a clearer and more refined picture of market momentum and directional bias.
The fundamental principle behind hollow candles lies in their ability to transform complex price movements into easily interpretable visual signals. In crypto trading, where markets operate continuously and price swings can be dramatic, understanding these candles can make the substantial difference between effective and ineffective trading strategies. The technique essentially acts as a filter, removing much of the random noise that characterizes short-term price fluctuations while preserving the integrity of longer-term trend information.
This charting method has gained particular popularity among cryptocurrency traders because it addresses one of the most challenging aspects of crypto markets: excessive volatility. By smoothing out erratic price movements, hollow candles enable traders to maintain focus on the broader market direction rather than being distracted by minor fluctuations that may not represent genuine trend changes.
Historical Background and Evolution
The Heikin-Ashi technique, from which hollow candles are derived, has its roots deeply embedded in Japanese trading traditions, similar to many other candlestick methodologies that have become standard in modern technical analysis. While the exact historical documentation remains somewhat limited, this method has been employed for several centuries to help traders filter out market noise and maintain focus on underlying trend structures.
Historically, the technique was primarily used in traditional stock and commodity trading markets, where Japanese traders sought ways to better understand price momentum and trend persistence. The method's effectiveness in these traditional markets laid the groundwork for its eventual adoption in more modern trading environments. With the advent of digital currencies and the emergence of cryptocurrency markets in recent years, the utility and application of hollow candles have expanded significantly, proving particularly valuable in navigating the unique characteristics of crypto trading.
The transition of this traditional technique into the cryptocurrency space represents a fascinating convergence of ancient trading wisdom and cutting-edge financial technology. As cryptocurrency markets have matured over the past decade, traders have increasingly recognized the value of time-tested technical analysis methods, adapting them to suit the specific challenges posed by digital asset trading.
Working Mechanism and Technical Framework
Hollow candles differentiate themselves from standard candlesticks through their unique approach to integrating and processing price data across time periods. Rather than simply plotting raw open, high, low, and close prices, the Heikin-Ashi method employs sophisticated calculations to create averaged values that smooth out price action and highlight momentum more effectively.
Each hollow candle is calculated using a specific formula that incorporates the close, open, high, and low prices from both the current and previous periods. This mathematical approach enables the candles to depict market momentum more clearly while eliminating much of the random volatility and noise commonly observed in highly volatile markets like cryptocurrency exchanges.
Key Elements and Calculation Methods of Hollow Candles:
-
Open Price Calculation: The open of a hollow candle is determined by calculating the midpoint (average) of the previous candle's open and close prices. This smoothing of the opening price helps eliminate gaps and creates more continuous price flow visualization.
-
Close Price Calculation: The close represents the average of the current period's open, high, low, and close prices, providing a balanced representation of the period's overall price action.
-
High and Low Determination: The high is the maximum value among the current high, open, and close, while the low is the minimum value among these three data points.
-
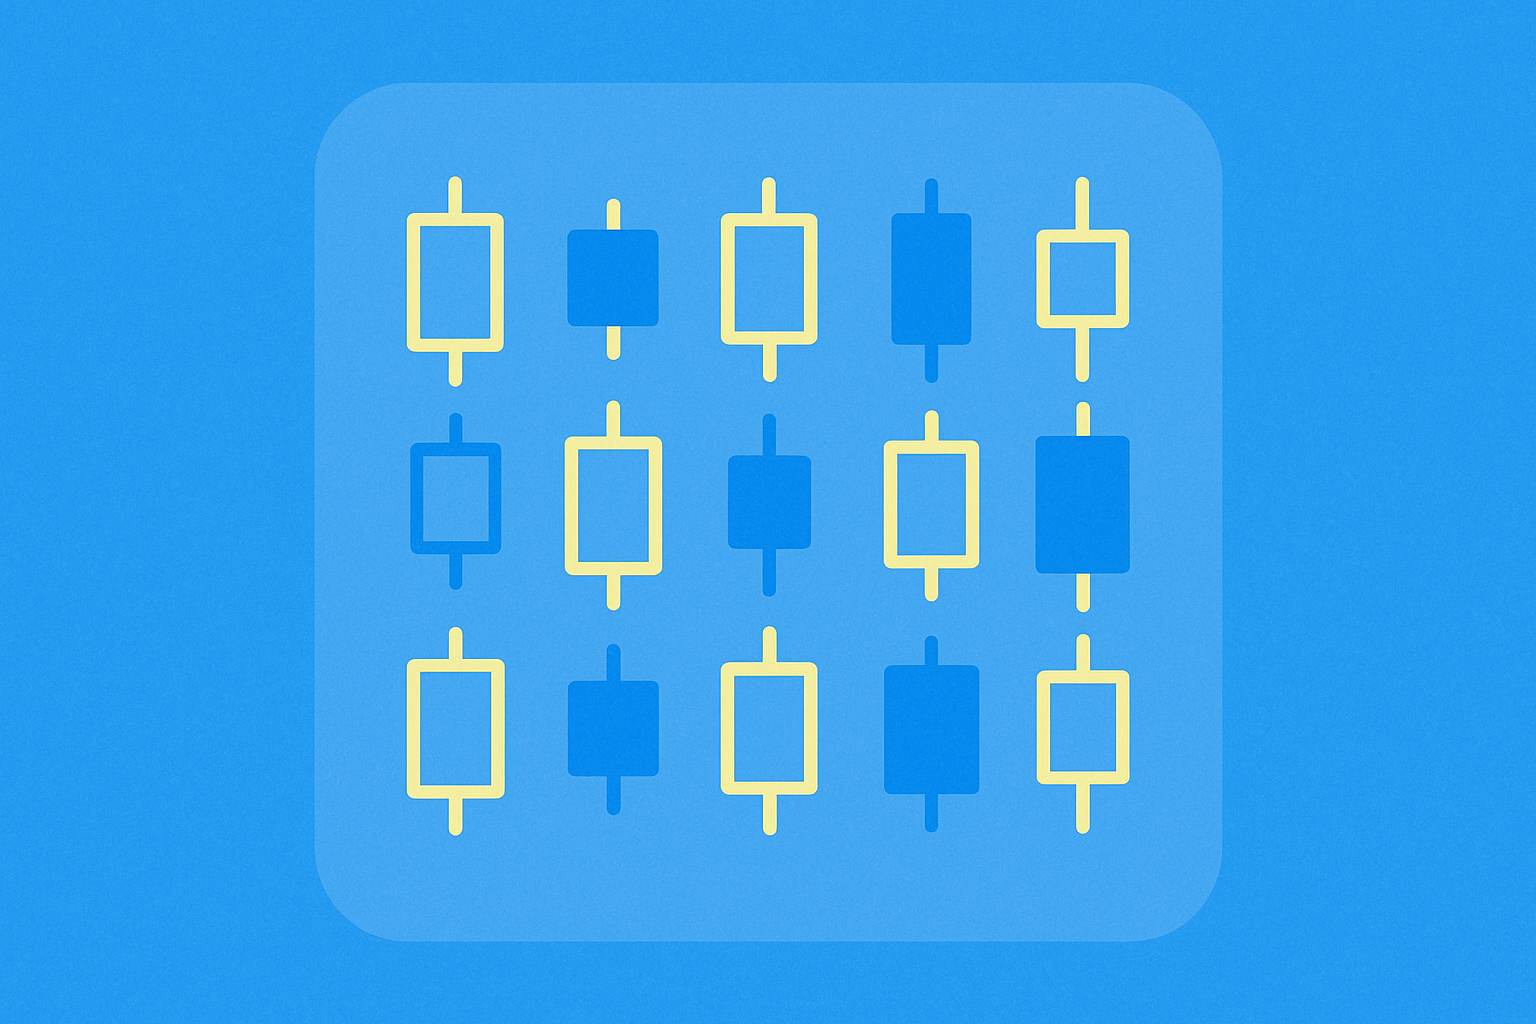
Color Coding System: Typically, a hollow or unfilled candle indicates rising prices and bullish momentum, while a filled candle signifies falling prices and bearish momentum. This visual distinction allows traders to quickly assess market direction at a glance.
-
Mathematical Formula: The Heikin-Ashi calculations utilize weighted averages of price data to filter market noise systematically, creating a more stable representation of price trends.
This sophisticated methodology smooths price transitions and makes persistent trends significantly more apparent, especially in the fluctuating and often chaotic markets that frequently characterize cryptocurrency trading environments. The result is a charting system that reduces false signals while maintaining sensitivity to genuine trend changes.
Benefits and Practical Advantages
Hollow candles offer numerous strategic advantages for traders, particularly those operating in the dynamic and often unpredictable cryptocurrency market environment:
-
Enhanced Trend Visibility: By systematically smoothing out market noise and random price fluctuations, hollow candles help traders identify genuine trends and potential reversal points with greater accuracy and confidence. This clarity is especially valuable in crypto markets where false breakouts and whipsaws are common.
-
Reduced Market Noise and False Signals: The inherent nature of hollow candles allows them to dampen the wild volatility often seen in cryptocurrency trading, filtering out insignificant price movements that don't represent meaningful market shifts. This reduction in noise helps traders avoid premature entries or exits based on temporary price spikes.
-
Improved Momentum Insight: Traders can develop a better understanding of whether market momentum is genuinely bullish or bearish, rather than being confused by short-term counter-trend movements. The continuous color coding of candles makes trend strength immediately apparent.
-
Easier Pattern Recognition: The smoothed nature of hollow candles makes classic chart patterns more recognizable and reliable, as the noise reduction helps patterns emerge more clearly from the price data.
-
Better Risk Management: With clearer trend signals, traders can position stop-losses more effectively and manage risk with greater precision, potentially improving overall trading performance and capital preservation.
Armed with this enhanced market understanding, traders can make more informed and strategic decisions about entry and exit points, thus optimizing their trading strategies and potentially improving their risk-adjusted returns in the challenging cryptocurrency markets.
Conclusion and Future Perspectives
The application of hollow candles in cryptocurrency trading represents a sophisticated and proven method for reading market trends and understanding complex price behavior patterns. As the cryptocurrency market continues to evolve and mature, analytical tools like hollow candles will likely become increasingly important components of successful trading strategies.
The ongoing development of cryptocurrency markets suggests that technical analysis methods will need to continuously adapt to new market dynamics and trading patterns. Hollow candles, with their proven ability to filter noise and highlight trends, are well-positioned to remain relevant and valuable tools in this evolving landscape. The technique's flexibility allows it to be combined with other technical indicators and analysis methods, creating comprehensive trading systems that can adapt to various market conditions.
Investors looking to make sense of volatile market movements and develop robust trading strategies should seriously consider incorporating this time-tested technique into their analytical toolkit. Whether you're a seasoned trader with years of experience or just beginning your journey in the crypto world, understanding and effectively utilizing hollow candles allows you to navigate the turbulent and often unpredictable cryptocurrency markets with greater precision and confidence.
As digital asset markets continue to develop and attract more institutional participation, the sophistication and nuanced understanding provided by tools like hollow candles will undoubtedly play an increasingly crucial role in shaping successful trading strategies and risk management approaches for the future. The convergence of traditional technical analysis wisdom with modern cryptocurrency markets creates opportunities for traders who invest time in mastering these analytical techniques.
FAQ
What are Hollow Candles in Cryptocurrency?
Hollow candles are candlestick patterns where the closing price is higher than the opening price, forming a hollow or white body. They indicate bullish momentum as buyers controlled the price movement during that period, suggesting potential upward price continuation.
How to identify and distinguish hollow candles from solid candles in K-line charts?
Hollow candles have open prices lower than close prices, showing an empty body. Solid candles have open prices higher than close prices, displaying a filled body. Hollow candles typically indicate bullish sentiment, while solid candles suggest bearish pressure. The wicks extend from the highest and lowest prices during that period.
What trading signals do hollow candles represent in technical analysis?
Hollow candles signal bullish momentum, indicating buyers controlled the session as closing price exceeded opening price. They suggest potential uptrend continuation and are often viewed as positive market sentiment indicators by traders.
What is the difference between hollow candles and solid candles, and what market implications do they each represent?
Hollow candles occur when closing price exceeds opening price, indicating bullish momentum. Solid candles form when closing price is below opening price, showing bearish pressure. Hollow candles suggest buyer strength, while solid candles indicate seller dominance in the market.
How to use hollow candles for cryptocurrency trading decisions?
Hollow candles indicate bullish momentum with higher closing prices than opening prices. Use them to identify potential buy signals when combined with support levels and increasing trading volume. Confirm trends by analyzing multiple candles together for stronger entry points in crypto markets.
Do hollow candles have the same meaning across different timeframes (1 minute, 1 hour, 1 day)?
Yes, hollow candles convey the same meaning across all timeframes. A hollow candle indicates closing price higher than opening price, showing bullish momentum. However, the significance varies by timeframe—1-minute hollow candles reflect short-term buying pressure, while 1-day hollow candles indicate stronger bullish trends and carry more weight in trading decisions.
What precautions should be taken when using hollow candles with other technical indicators?
Combine hollow candles with volume analysis, moving averages, and support/resistance levels for confirmation. Avoid relying solely on candle patterns; use multiple indicators to filter false signals and improve trade accuracy. Verify signals across different timeframes before making decisions.

Decoding the KDJ Indicator: A Comprehensive Guide

How to Interpret MACD and RSI Signals for Cryptocurrency Trading?

How to Use MACD, RSI, and KDJ Indicators for Effective Crypto Trading?

How to Use MACD, RSI, and KDJ Indicators for Technical Analysis of Cryptocurrencies?

Understanding Crypto Chart Patterns for Effective Trading

Mastering KDJ for Successful Crypto Trading Strategies

How to Get TRC20 Wallet Address Easily

What Are Blockchain-Powered Games?
What is Open AI Stock Symbol: Essential Guide for Crypto Users
Elon Musk Talk About Pi Network: Fact or Fiction?

Sharpe Ratio