What is Hyperliquid (HYPE) market overview: price, market cap, trading volume and liquidity analysis?
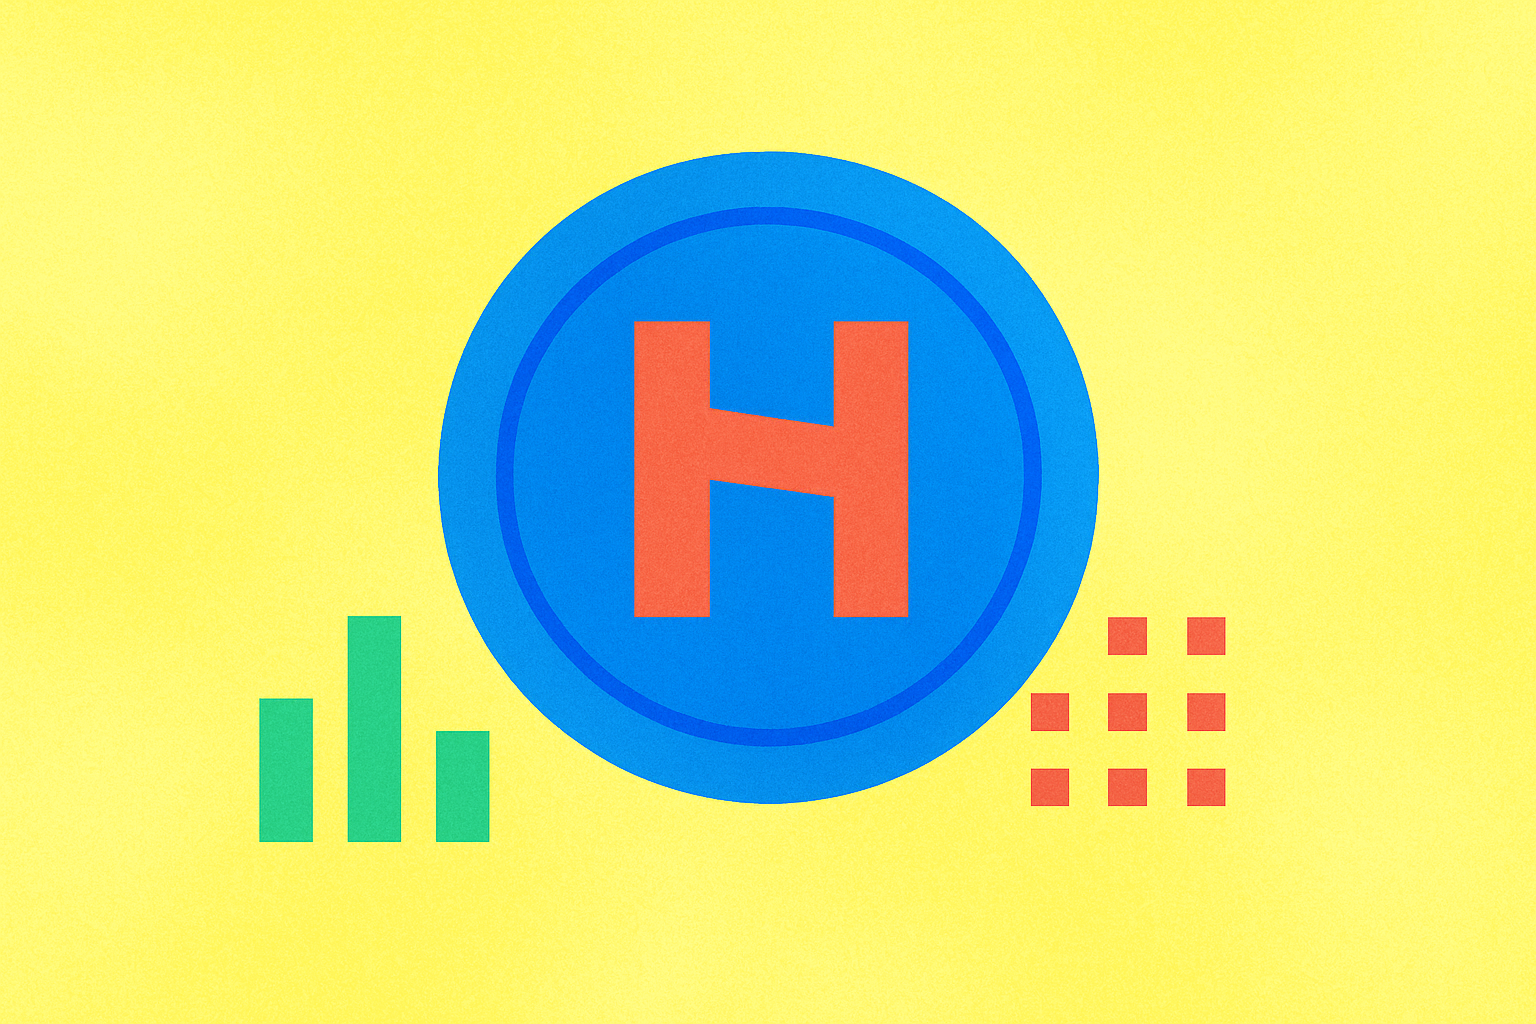
Hyperliquid (HYPE) ranks #14 in market cap with a valuation of $8.17 billion and circulating supply of 336.69 million tokens
With a market capitalization of $8.17 billion, Hyperliquid has established itself as a significant player in the cryptocurrency ecosystem, commanding the 14th position in overall market rankings. This standing reflects substantial investor confidence in the platform's vision of building a fully onchain open financial system. The valuation demonstrates how the market values HYPE's unique positioning as a high-performance L1 blockchain optimized specifically for decentralized finance applications.
The circulating supply of 336.69 million tokens represents the currently active HYPE tokens available in the market, which directly determines the token price relative to the total market capitalization. This supply level is particularly meaningful when considered against the maximum total supply, indicating significant room for future token releases through various allocation mechanisms including community rewards, future emissions, and core contributor vesting schedules. Understanding this supply dynamic helps investors gauge the token's scarcity profile and potential dilution scenarios as the network matures and additional tokens enter circulation.
Trading volume reaches $225 million in 24 hours with price volatility between $23.82 and $25.25
Hyperliquid demonstrates robust market activity with 24-hour trading volume reaching $225 million, a compelling metric that reflects substantial trader engagement on the platform. This significant trading volume showcases the cryptocurrency's liquidity and the active participation across the Hyperliquid ecosystem, indicating healthy market conditions and consistent demand for the asset.
The HYPE token experienced price volatility between $23.82 and $25.25 during this 24-hour period, representing meaningful price movements that reflect dynamic market sentiment. This trading range demonstrates the inherent price discovery mechanisms at work within the Hyperliquid DEX, where each order, cancellation, and trade occurs transparently on-chain. The relatively tight volatility band suggests stabilizing market conditions following recent developments.
This volume and price activity deserve context within Hyperliquid's broader market dynamics. The platform's high-performance architecture—designed to handle permissionless financial applications with block latency under 1 second—enables the substantial trading throughput evidenced by these figures. The combination of impressive trading volume and manageable price volatility indicates market participants have confidence in the platform's capabilities. As Hyperliquid continues establishing itself as a leading on-chain derivatives platform, metrics like these $225 million trading volumes and price discovery patterns on gate become increasingly important indicators of ecosystem maturation and trader adoption rates.
Strong liquidity metrics with $225 million daily trading volume and multi-exchange coverage across major platforms
Hyperliquid demonstrates robust market infrastructure with its $225 million daily trading volume distributed across major platforms, reflecting the HYPE token's increasing adoption and trading activity. This multi-exchange coverage ensures traders maintain consistent access to liquidity regardless of their preferred trading venue, a critical factor for any emerging asset. The platform's distinctive feature lies in its on-chain order book depth, which has achieved unprecedented levels—during notable token launches, Hyperliquid exhibited the deepest market depth and tightest spreads compared to leading centralized exchanges, marking a watershed moment for decentralized finance. The liquidity metrics extend beyond spot trading, with perpetual futures demonstrating exceptional depth. The HYPE token's liquidity is further strengthened through the community vault mechanism, enabling users to participate in market making while earning yield. This dual-layer approach—combining direct trading volume with incentivized liquidity provision—creates sustainable market conditions that attract both retail and institutional participants seeking reliable execution. The convergence of multiple exchange listings with sophisticated on-chain liquidity infrastructure positions Hyperliquid's HYPE token as having among the strongest liquidity profiles in the emerging blockchain ecosystem.
FAQ
What is Hyperliquid (HYPE)? What are its main uses and innovations?
Hyperliquid (HYPE) is a decentralized exchange operating on its own blockchain, offering perpetual futures trading with low latency. Its innovation includes HyperEVM and HyperBFT protocols enabling high-speed, reliable trading. Native token HYPE powers governance and economic incentives.
What is the current price of HYPE token? What are the all-time high and all-time low prices?
HYPE's all-time high price is US$0.007833 and all-time low is US$0.00006539. Current price fluctuates based on market conditions and trading activity in real-time.
What is Hyperliquid's market cap ranking? How does its scale compare to other major cryptocurrencies?
As of January 3, 2026, Hyperliquid ranks 19th by market cap with daily trading volume exceeding 600 million USD. Compared to major cryptocurrencies, its scale remains relatively modest but demonstrates strong growth momentum in the decentralized derivatives sector.
What is HYPE's daily trading volume? On which exchanges can it be traded?
HYPE's daily trading volume reaches approximately US$14.58, primarily on Uniswap V2. The token is actively traded on decentralized exchanges with the HYPE/WETH pair being the most active trading pair.
How is the liquidity of Hyperliquid? What are the trading depth and bid-ask spread?
Hyperliquid provides excellent liquidity with deep order books and tight bid-ask spreads, ensuring efficient trading. Market depth is substantial, enabling stable price movements with minimal slippage for traders.
What are the total supply and circulating supply of HYPE tokens? How is the token distribution mechanism structured?
HYPE has a maximum supply of 1 billion tokens. The circulating supply details are not publicly disclosed. Token distribution occurs through community incentives, governance participation, staking rewards, and transparent release schedules aligned with ecosystem development.
What are the main risks of investing in Hyperliquid? How should you evaluate its investment value?
Main risks include validator concentration on mainnet and EVM not yet launched. Evaluate value by analyzing platform utility, trading volume growth, upcoming features, and market adoption potential. Consider technological development progress and competitive positioning in derivatives trading.
FAQ
HYPE coin是什么?它的主要功能和用途是什么?
HYPE coin is the native token of Hyperliquid Layer 1 blockchain, used for delegated proof-of-stake, governance voting, transaction fees, and ecosystem value capture in the decentralized perpetual futures exchange.
How to buy and trade HYPE coin? Which exchanges and wallets are supported?
Purchase HYPE coin through decentralized exchanges using Web3 wallets. Connect wallets like MetaMask or Trust Wallet, deposit base assets such as SOL or ETH, then swap for HYPE. Store tokens in your Web3 wallet for security and full control.
What is the technical foundation of HYPE coin? What blockchain technology does it adopt?
HYPE coin is built on a custom Layer 1 blockchain with Hyper BFT consensus mechanism, capable of processing up to 200,000 transactions per second. It features a fully on-chain limit order book architecture.
What are the risks of investing in HYPE coin? What issues need attention?
HYPE coin carries market volatility and regulatory risks. Monitor trading volume, liquidity conditions, and market sentiment carefully. Price fluctuations can be significant; ensure adequate risk management in your investment strategy.
What is the total supply of HYPE coin? How are tokens allocated and what is the unlock mechanism?
HYPE coin has a total supply of 1 billion tokens. 31% (310 million) allocated to early users, 23.8% (238 million) reserved for core team and future contributors. Remaining tokens unlock gradually through a structured release schedule.
How is HYPE coin's team background and project progress?
HYPE coin's team includes founder Jeff Yan, former manager of a $50 billion crypto trading firm, and technical experts from MIT and Citadel. The project has achieved significant milestones in high-frequency trading and blockchain development, positioning itself as a leading DeFi innovation platform.

How do derivatives market signals affect ASTER trading in 2025: funding rates, open interest, and liquidation data analysis?

How does Aster compare to Hyperliquid in the DEX market: trading volume, market share, and leverage differences

What are the key derivatives market signals: futures open interest, funding rates, and liquidation data explained?

How does HYPE compare to Hyperliquid competitors like Aster and edgeX in market cap and trading volume?
What is Tradoor (TRADOOR) market overview: price, market cap, and 24-hour trading volume

How much has MYX Finance price fluctuated in 24 hours and what are the support and resistance levels?

What is the current crypto market cap ranking and trading volume overview in 2026?

What Is Crypto On-Chain Data Analysis and How Does It Predict Price Movements

How to Use MACD, RSI, and Bollinger Bands for Crypto Trading Success

What is on-chain data analysis and how does it predict crypto price movements

What is the fundamental analysis of a cryptocurrency project: whitepaper logic, use cases, and team background explained
