What is INJ price volatility and how does Injective compare to Bitcoin and Ethereum in 2026?
INJ price volatility at 6.59% in 24 hours shows distinct patterns compared to traditional assets
Injective's 6.59% 24-hour volatility represents a significant pricing movement that demonstrates characteristic behaviors of digital assets in 2026. This INJ price volatility manifests through pronounced clustering patterns, where sharp price movements tend to concentrate within specific timeframes rather than distributing evenly throughout the day. The cryptocurrency experienced price swings between $3.80 and $15.40, illustrating how rapidly sentiment shifts within the digital asset space.
The distinct patterns of Injective's 24-hour volatility diverge notably from traditional assets like equities and bonds. While traditional markets increasingly face volatility from macroeconomic news and earnings reports, INJ volatility behavior exhibits characteristics such as fat tails and skewness—meaning extreme price movements occur more frequently than statistical models would predict for conventional securities. This reflects the decentralized, continuously-active nature of cryptocurrency markets operating outside standard trading hours.
Liquidity dynamics substantially amplify these volatility patterns in Injective's trading ecosystem. Unlike stock markets with concentrated trading during business hours, cryptocurrency volatility persists across weekends and overnight periods when institutional oversight diminishes. The leverage effect—where price declines trigger additional selling pressure—remains pronounced in INJ markets compared to traditional alternatives, creating self-reinforcing volatility spikes. Market adaptation and regulatory shifts further intensify these distinctive volatility characteristics, positioning Injective's price movements as fundamentally different from equity and bond volatility structures observed in 2026.
Support and resistance levels form a descending triangle with price trading below key moving averages
The descending triangle pattern emerges when price action creates progressively lower highs while maintaining a relatively flat support line, forming a distinctive wedge shape that compresses toward a breakout point. In INJ's technical structure, this pattern reflects a bearish consolidation phase where selling pressure gradually intensifies. The horizontal support level represents where buyers historically defend price levels, while the declining resistance line demonstrates the diminishing strength of each successive bounce during the downtrend.
When INJ price trades below key moving averages—such as the 50-day or 200-day moving average—it reinforces the bearish narrative that the descending triangle suggests. These moving averages serve as dynamic support zones; their violation typically signals momentum continuation toward lower levels. The positioning of INJ's price action beneath these technical barriers suggests buyers lack conviction to mount sustained recovery attempts. During descending triangle formations, the convergence of lower highs and this moving average breakdown creates a critical juncture where traders anticipate potential breakout movements.
Breakouts below the horizontal support level within a descending triangle pattern often trigger accelerated declines, as trapped buyers exit positions and new sellers enter aggressively. This technical setup historically precedes significant price moves, making INJ's current configuration relevant for understanding its volatility profile relative to broader market movements and comparing its technical strength against established cryptocurrencies.
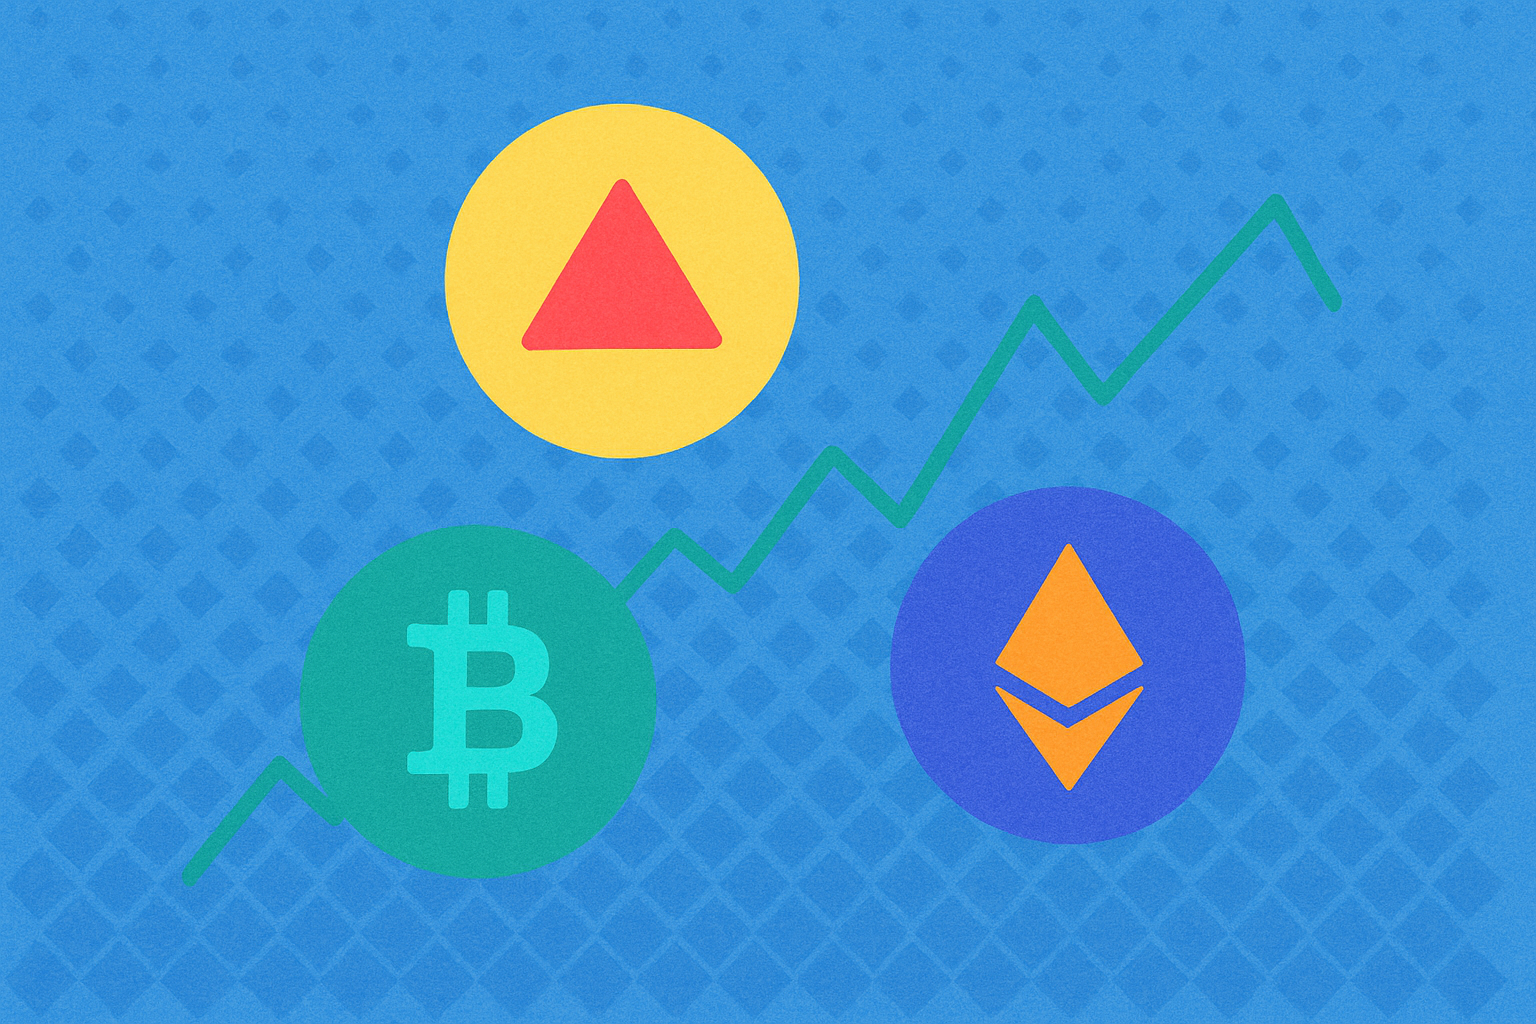
INJ demonstrates lower correlation to Bitcoin and Ethereum with independent market behavior
The cryptocurrency market structure has undergone a notable transformation in 2026, with INJ displaying markedly different price patterns compared to Bitcoin and Ethereum. This divergence reflects a fundamental shift in how traders and investors are allocating capital across blockchain assets. Bitcoin's dominance fell below the critical 60 percent threshold, signaling increased investor interest in alternative layer-one solutions and specialized blockchain ecosystems.
INJ's independent market behavior stems from its distinct positioning within the DeFi and Web3 finance sector. Rather than moving in lockstep with Bitcoin price action or Ethereum trends, INJ responds more directly to ecosystem-specific developments, protocol upgrades, and adoption metrics within the Injective ecosystem. The Altcoin Seasonal Activity Index declined from 43 to 37, reflecting how altcoins like INJ are now driven by their own fundamental narratives rather than broad cryptocurrency market sentiment.
Market analysts have increasingly shifted focus from short-term price targets to broader macroeconomic conditions that uniquely impact different assets. This shift has profound implications for INJ's correlation dynamics. While Bitcoin's movements have become influenced by Federal Reserve policy concerns and dollar strength, INJ's price action correlates more closely with institutional adoption of derivative trading infrastructure and decentralized finance innovation.
Cryptocurrency ETF flows demonstrate this divergence clearly, with altcoins attracting steady investment independent of Bitcoin's performance. INJ benefits from this recalibration, as investors recognize that lower correlation to major cryptocurrencies provides portfolio diversification. The independent market behavior suggests INJ will continue charting its own course throughout 2026, responding primarily to Injective ecosystem developments and the broader adoption of layer-one blockchain alternatives rather than mirroring Bitcoin and Ethereum volatility patterns.
FAQ
What is INJ (Injective) and what are its main functions and uses?
Injective (INJ) is a Layer 1 blockchain designed for decentralized finance. It features on-chain order books, cross-chain interoperability, and modular architecture. INJ token is used for governance, staking, paying transaction fees, and earning rewards from liquidity provision and trading activities.
Injective的价格波动性主要由哪些因素驱动?
Injective价格波动性主要由供需动态、市场情绪、新闻事件、交易额变化和宏观经济因素驱动。链上活动增长、生态发展和投资者预期也显著影响其价格表现。
What are the differences between INJ, Bitcoin, and Ethereum in technical features and application scenarios?
Bitcoin focuses on peer-to-peer payments with limited programmability. Ethereum enables smart contracts supporting DApps and DeFi. Injective specializes in decentralized derivatives trading with advanced oracle technology, optimizing for financial applications on Web3.
From 2024-2026, how has INJ performed historically compared to BTC and ETH?
INJ outperformed BTC and ETH during 2024-2026, demonstrating higher growth with greater volatility. While BTC and ETH showed steady gains, INJ exhibited stronger upside potential, reflecting emerging cryptocurrency market dynamics and investor interest in layer-1 solutions.
What are the main risks of investing in INJ compared to Bitcoin or Ethereum?
INJ carries higher volatility risk due to lower market liquidity and smaller trading volume compared to Bitcoin and Ethereum. Additionally, INJ faces greater regulatory uncertainty and lower adoption rates, making it more susceptible to market sentiment shifts and price fluctuations.
2026年INJ的价格预测和增长潜力如何?
Injective (INJ) is expected to achieve significant growth in 2026, with predicted price range of $122.05 to $148.83. Average price for 2027 projected at $125.61, indicating strong growth potential ahead.
What important updates in Injective's development roadmap could impact its 2026 performance?
Injective's 2026 roadmap includes expanding cross-chain DeFi capabilities, launching new dApps, and enhancing infrastructure. These developments aim to drive user adoption and increased transaction volumes. Expected growth suggests INJ could reach $30-$40 by 2026.

# How Does Chainlink (LINK) Price Volatility Compare to Bitcoin and Ethereum in 2025?
How Does UNI Price Volatility Compare to Bitcoin and Ethereum in 2025?

How Does Cryptocurrency Competitor Analysis Drive Market Share in 2025?
# How Does UNI Price Volatility Compare to Bitcoin and Ethereum in 2025?
What is HYPE price volatility: support levels, 2027 predictions, and market fluctuations explained
What Is Altseason? Why the Crypto Market Expects It
How to Get Free Bitcoins on Cash App

How to Use MACD, RSI, and Bollinger Bands for Crypto Trading Signals in 2026
How Many Lydian Lion Coins Are There in Crypto?
How does competitive analysis shape crypto token market share and performance in 2026
What is SOLV Protocol token: price, market cap, and 24-hour trading volume overview