What is LAB crypto market cap and 24-hour trading volume
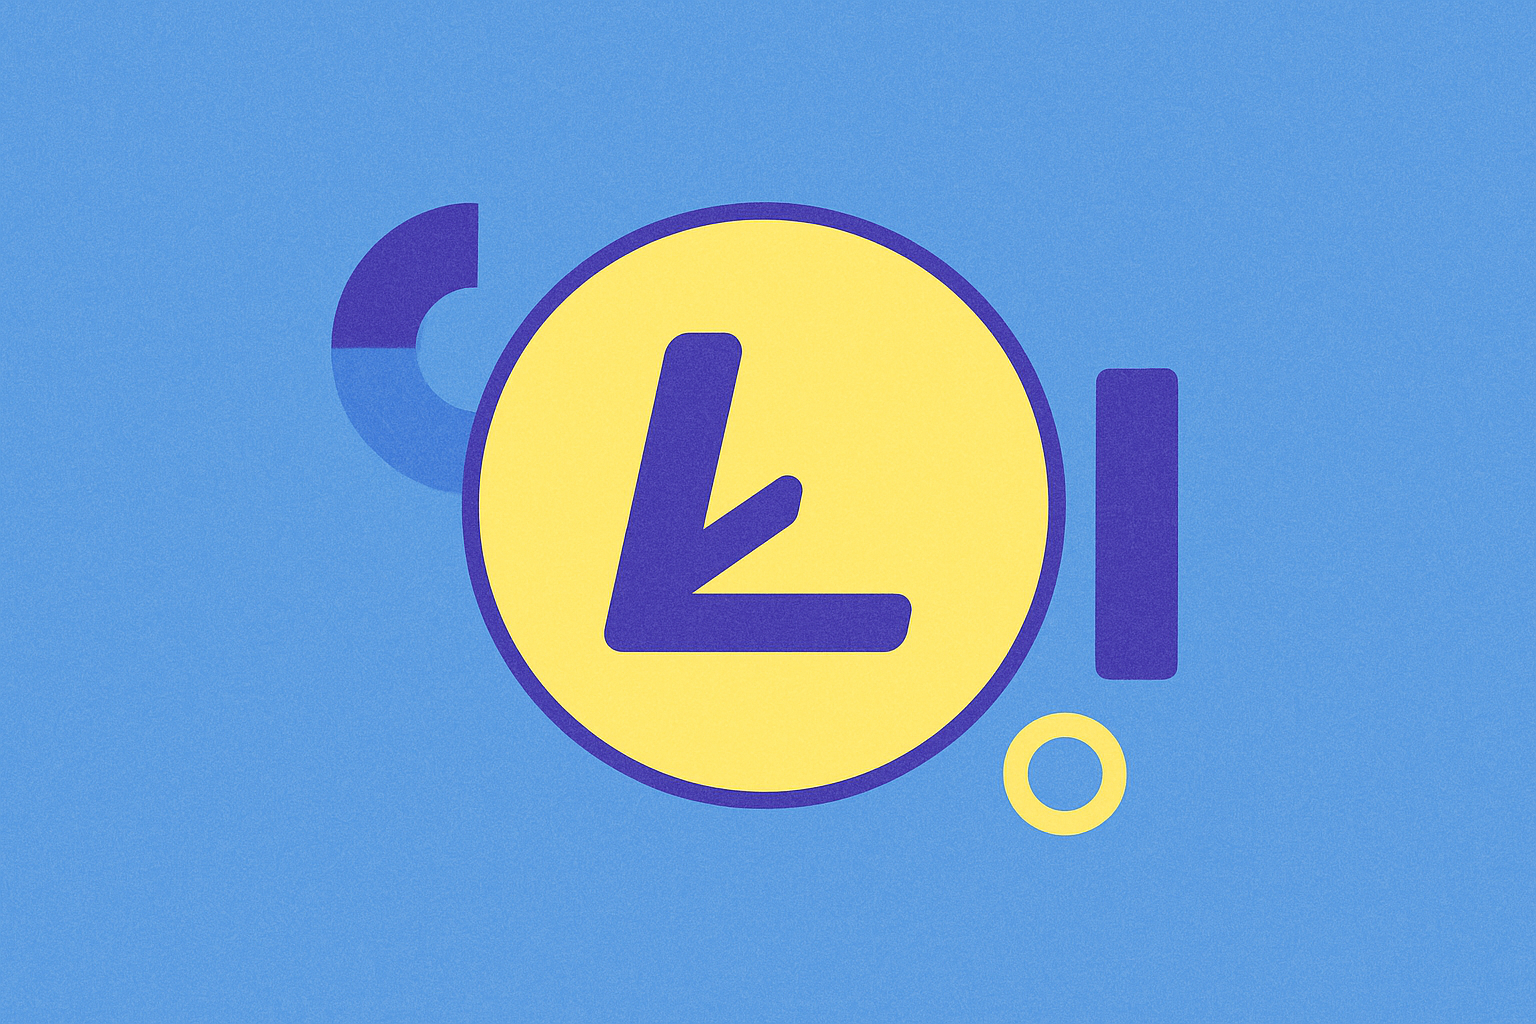
LAB Token Market Cap Reaches $139.93 Million with Current Price at $0.13
LAB token has demonstrated notable market valuation metrics, with its market cap reaching significant levels in early 2026. The cryptocurrency's valuation reflects strong market interest in the multi-chain trading infrastructure platform. At a price point of $0.13, LAB maintains a substantial position within the broader crypto ecosystem, ranking among mid-tier digital assets. The trading volume surrounding LAB reflects active market participation, with millions in daily transaction value across various trading pairs and exchanges. This combination of market cap size and consistent trading activity indicates investor confidence in the platform's capabilities. LAB's infrastructure, which integrates spot, limit, and perpetual contract trading alongside AI-powered research features, has attracted growing attention from traders seeking high-performance execution solutions. The token's valuation metrics place it within a competitive range of altcoins, though price fluctuations remain characteristic of the cryptocurrency market. Understanding LAB's market position through these metrics provides context for evaluating the token's market penetration and adoption trajectory among trading platforms and users seeking advanced trading tools.
24-Hour Trading Volume of $713,605 Reflects Current Market Activity
The 24-hour trading volume serves as a crucial indicator of market health and investor engagement with LAB token. This metric captures the total value of LAB traded across all exchanges within a single day, providing real-time insight into market liquidity and trading interest. When examining trading volume patterns, investors gain visibility into whether the market is actively participating in LAB transactions or experiencing diminished interest.
Active trading volume demonstrates healthy market dynamics and indicates genuine demand for the asset. During periods of significant price movement, elevated trading volume typically accompanies the shift, suggesting that price changes reflect substantial market participation rather than thin-book trading. Conversely, lower volume periods may indicate consolidation phases or reduced investor activity.
For LAB token specifically, understanding 24-hour trading volume helps traders assess execution opportunities and market accessibility. Higher trading volumes generally mean tighter bid-ask spreads and more efficient order execution on platforms. This metric also influences the cryptocurrency's overall market perception, as consistent volume activity strengthens the asset's credibility among traders and investors seeking liquid positions. By monitoring how trading volume fluctuates relative to price movements, market participants can better understand whether current market activity represents strong conviction or temporary speculation.
Circulating Supply of 230.40M Against Maximum Supply of 1.00B Indicates Token Distribution
The LAB token distribution reflects a carefully structured supply model that influences market dynamics and investor expectations. With 230.40 million tokens currently circulating against a maximum supply of 1.00 billion, LAB maintains a distribution rate of approximately 23 percent of its total potential supply. This tokenomics structure suggests a deliberate rollout strategy, with substantial token reserves remaining for future distribution through staking rewards, platform incentives, or ecosystem development.
This balanced approach to token allocation is typical of infrastructure projects like LAB, which operates as a multi-chain trading platform. The gap between circulating and maximum supply provides flexibility for long-term growth and community incentives without immediate market saturation. Investors analyzing LAB's market cap of $45.43 million should recognize that this valuation applies only to the current circulating supply, while the fully diluted valuation at $197.19 million accounts for all potential tokens. Understanding this distinction is crucial for evaluating the cryptocurrency's true long-term value potential and dilution risk.
FAQ
What is LAB cryptocurrency's current market cap?
LAB's current market cap is S$29.01 million as of January 19, 2026. This reflects its significant value and position in the cryptocurrency market.
What is LAB token's 24-hour trading volume?
LAB token's 24-hour trading volume is $5.00 million as of January 19, 2026. This represents the total transaction value across all markets during the past 24 hours.
What are the all-time high and low prices of LAB?
LAB's all-time high price is $0.45767. The all-time low price has not been officially recorded yet.
Where can LAB tokens be traded?
LAB tokens are available for trading on OKX exchange. Users can trade LAB directly on the platform using various trading pairs and modes. For the most current exchange listings and trading options, please visit the official exchange platforms.
What are LAB's circulating supply and total supply respectively?
LAB's circulating supply is currently unknown. The maximum supply and total supply are both 1 billion tokens.
What is LAB's ranking in cryptocurrency market capitalization?
LAB is ranked #1619 in the cryptocurrency market cap rankings, with a circulating supply of 1 billion LAB tokens and a market capitalization valued in USD.
What is the Current Crypto Market Cap Ranking and 24H Trading Volume Overview?

How to Use MACD, RSI, KDJ, and Bollinger Bands for Crypto Technical Analysis
What Is Crypto Market Overview: Market Cap Rankings, Trading Volume, and Liquidity Analysis?

What is the Current Crypto Market Overview: Market Cap Rankings, Trading Volume, and Liquidity Analysis
What is FUNToken (FUN) price today and how does its market cap compare to other cryptocurrencies

What is CRO price volatility: support resistance levels and 13.6% daily swings analysis
What are crypto derivatives market signals and how do futures open interest, funding rates, and liquidation data predict price movements
What is causing SENTIS price volatility and how has it dropped 4.70% in 24 hours?
What is WalletConnect (WCT) token and how does its core whitepaper logic drive Web3 wallet connectivity?
What is WFI price volatility and how did it surge 112% in 2025
What is cryptocurrency competitive analysis: comparing Bitcoin, Ethereum, and altcoins market share in 2026