fomox
MarketsPerpsSpotSwap
Meme
Referral
More
Become a Smart Money on Tracker
Search Token/Wallet
/

What is the current crypto market overview in 2026: market cap rankings, trading volume, and liquidity analysis

2026-01-13 04:58:11
Bitcoin
Crypto Trading
Cryptocurrency market
Ethereum
Stablecoin
Classificação do artigo : 4
99 classificações
This comprehensive guide examines the 2026 cryptocurrency market landscape, revealing Bitcoin's commanding $1.81 trillion market cap dominance within a $3.07 trillion global market. The article analyzes current market cap rankings where Ethereum and Solana secure second and third positions, while providing critical insights into valuation trends and institutional adoption patterns. Trading volume analysis reveals sophisticated market evolution, with $27.50 billion in daily trading volume distributed across spot markets, derivatives, and decentralized exchanges, including institutional flows through Bitcoin ETFs and emerging prediction markets. Liquidity assessment demonstrates robust market depth on major platforms like Gate, examining order book structure, execution quality, and exchange accessibility for traders. The content addresses key investor concerns regarding price stability, stablecoin expansion, and market maturity indicators. Ideal for traders, institutional investors, and crypto enthusiasts seeki
What is the current crypto market overview in 2026: market cap rankings, trading volume, and liquidity analysis

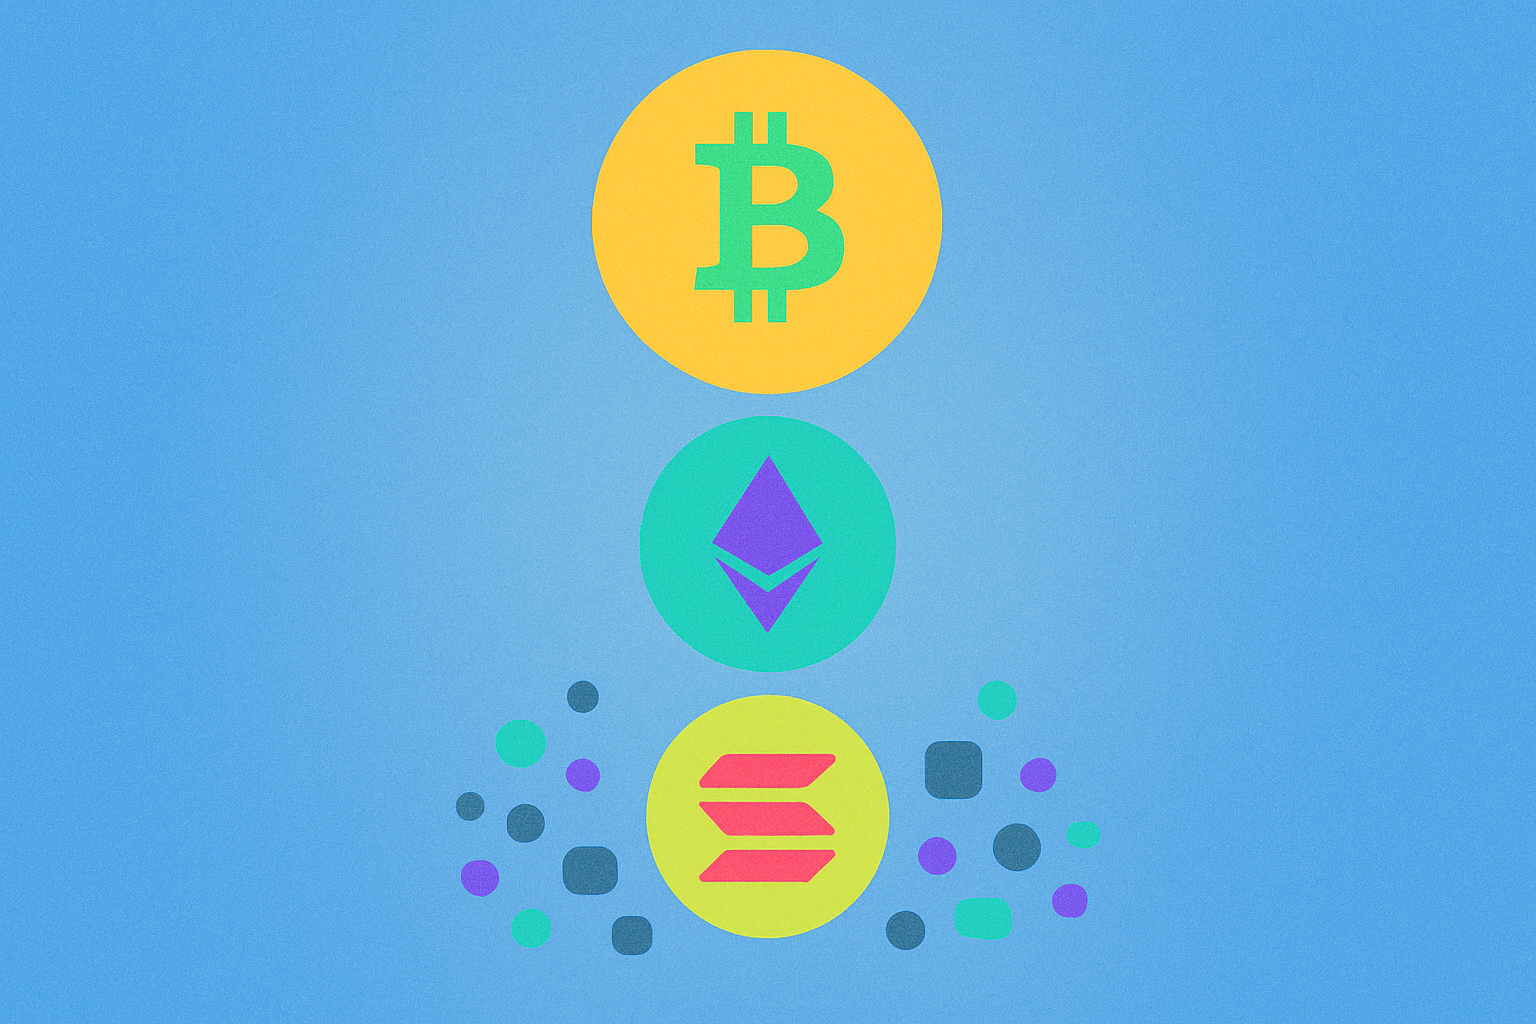
Bitcoin maintains its commanding position in the cryptocurrency market landscape, leading with a market capitalization of $1.81 trillion and trading near $90,600 per coin as of January 2026. The global cryptocurrency market cap stands at $3.07 trillion, demonstrating the sector's substantial institutional presence and broader adoption. Ethereum and Solana secure second and third positions respectively, continuing their established roles as major market players with significant valuations that reflect investor confidence in their ecosystems and technological innovations. The ranking dynamics reveal interesting valuation trends, where established cryptocurrencies retain dominance while emerging projects vie for prominence through differentiated use cases and network effects.

Notably, stablecoins have emerged as a critical market segment, with their capitalization expanding significantly and projecting further growth throughout 2026. This expansion reflects increasing demand for price-stable digital assets in trading volume and settlement activities across decentralized exchanges and blockchain platforms. Bitcoin's recent 7-day performance showed a -2.31% adjustment, illustrating typical market volatility while the asset consolidates its position among the world's top 10 largest assets by market cap. The cryptocurrency market structure demonstrates improving maturity, with institutional-grade infrastructure supporting the trading volume required for meaningful price discovery and liquidity provision across major market participants.

Trading volume analysis: 24-hour and 7-day performance across major digital assets

The cryptocurrency market's trading volume dynamics in 2026 reveal a complex institutional adoption story, where 24-hour trading volumes have diverged notably from 7-day averages across major digital assets. Despite positive price momentum, institutional flows have failed to accelerate meaningfully, with 24-hour volume tracking approximately 5.88% below the 7-day average, signaling cautious participation from larger market participants even as retail activity intensifies.

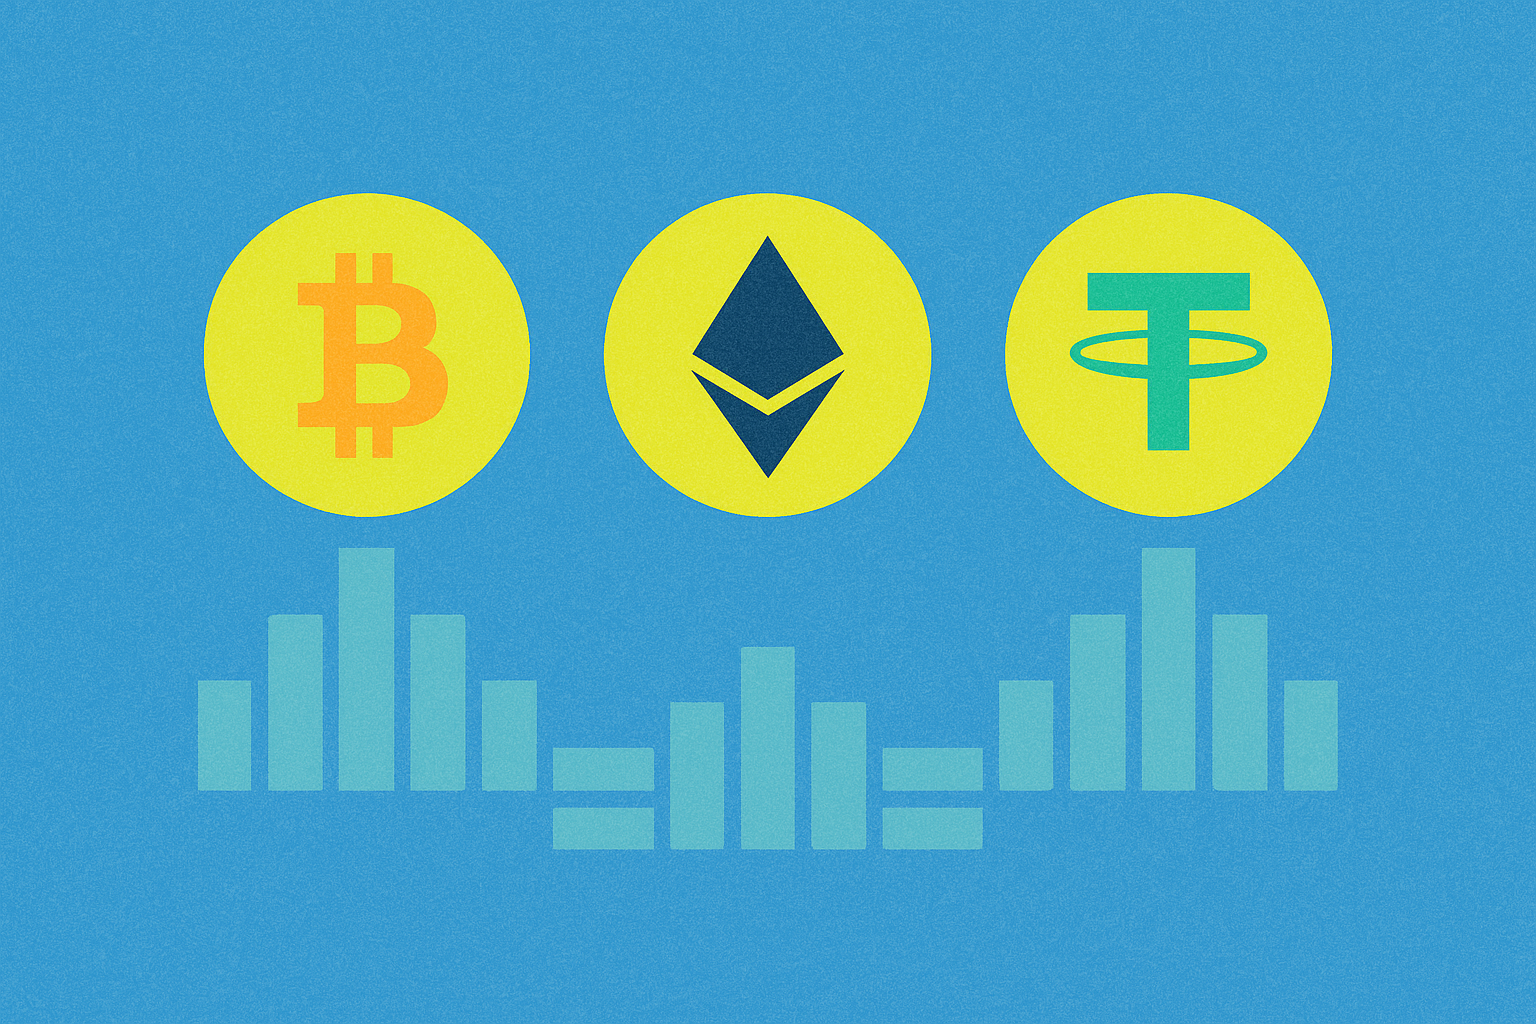
Bitcoin and Ethereum lead trading volume across spot and derivatives markets, with Bitcoin ETFs alone generating $880 billion in trading volume and securing $16 billion in net inflows. This institutional migration toward regulated products contrasts sharply with derivative exchange volumes, where perpetual DEXs have captured substantial market share—reaching 18% of centralized exchange volume, with platforms like Hyperliquid achieving 14% of certain competitors' futures volumes. Major assets like XRP demonstrate the sector-wide activity, posting $4.74 billion in 24-hour trading volume, though underperformance relative to broader market surges suggests uneven institutional allocation patterns.

Prediction markets emerged as unexpected volume drivers, generating $28 billion in volume—a 4.3x increase—indicating growing institutional interest in alternative trading verticals. This fragmented volume distribution across spot exchanges, perpetual DEXs, and emerging trading venues reflects the market's ongoing structural evolution toward a more sophisticated, multi-venue landscape serving increasingly diversified institutional strategies and execution preferences.

Liquidity assessment and exchange coverage: market depth and accessibility evaluation

Assessing liquidity in the cryptocurrency market requires evaluating multiple dimensions beyond simple volume metrics. Market depth analysis examines order book structure, distinguishing between top-of-book immediate liquidity and cumulative depth across various price levels. Current data reveals the crypto market maintains $27.50 billion in 24-hour trading volume, with $19.16 billion concentrated in spot markets and $11.302 billion on decentralized exchanges, indicating robust but fragmented liquidity distribution.

Execution quality metrics measure slippage—the difference between expected and actual trade prices—alongside transaction costs and processing speed. Centralized exchanges typically deliver superior market depth compared to their decentralized counterparts, offering tighter spreads and faster execution due to centralized order matching. Platforms like MEXC demonstrate comprehensive coverage with over 3,000 trading pairs, enabling traders to access diverse assets.

Exchange accessibility extends beyond trading features to regulatory compliance. Most major platforms implement KYC (Know Your Customer) verification requirements, which vary significantly by jurisdiction and affect user onboarding. These requirements establish baseline accessibility standards while addressing regulatory obligations, though verification processes differ globally. Market maker incentive programs further enhance liquidity by compensating participants for maintaining tight spreads and stable order books, creating sustainable trading environments that benefit all participants through improved market efficiency.

FAQ

What is the total market capitalization of cryptocurrencies in 2026? How much has it grown compared to 2025?

As of early January 2026, the global cryptocurrency market cap reached approximately 3.12 trillion USD, representing a 5% increase from the 2.97 trillion USD recorded at the end of 2025, reflecting strong market recovery and investor confidence.

What are the top 10 cryptocurrencies by market cap in 2026, and what is their market share percentage?

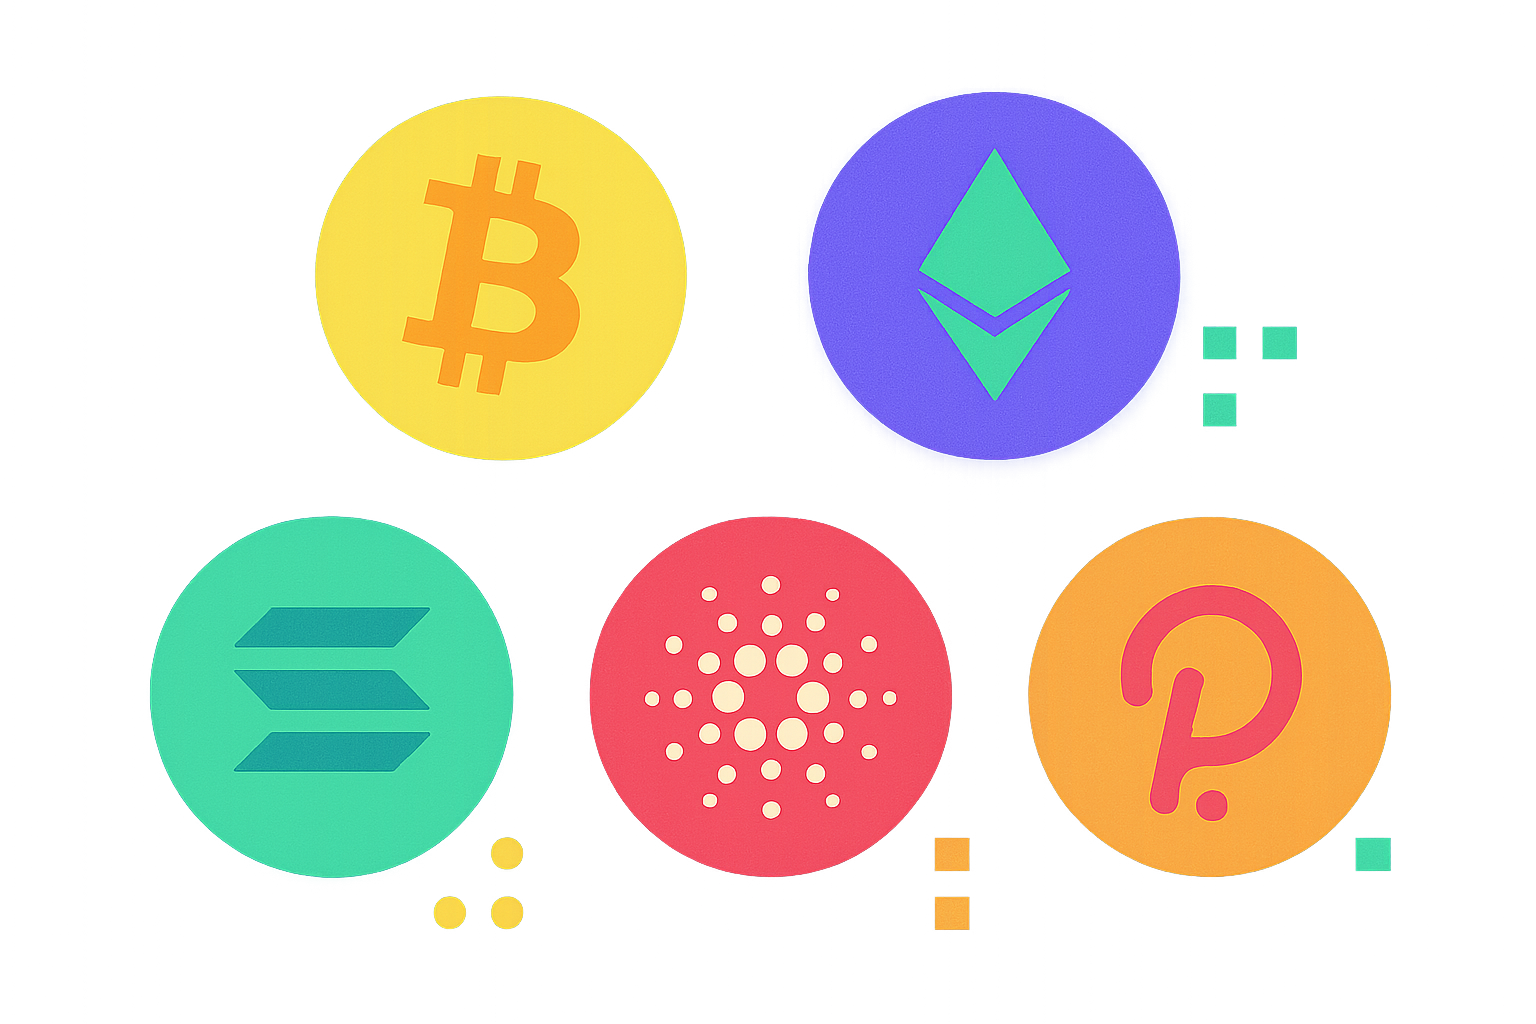
In 2026, the top 10 by market cap are Bitcoin (25%), Ethereum (15%), Litecoin (5%), Ripple (4%), Dogecoin (3%), Cardano (2%), Polkadot (2%), Filecoin (1%), Monero (1%), and Nakamoto (1%).

What is the daily average trading volume in the cryptocurrency market in 2026? Which exchanges have the largest trading volume?

In 2026, the crypto market's daily average trading volume reaches tens of trillions of dollars. Leading exchanges like Binance demonstrate dominant trading volume with record-breaking 24-hour and 7-day figures, providing high liquidity and active trading for global investors.

What is the liquidity situation of mainstream cryptocurrencies such as Bitcoin and Ethereum in 2026?

Mainstream cryptocurrencies show robust liquidity in 2026, driven by institutional capital inflows and improved market depth. Bitcoin and Ethereum maintain strong trading activity with consistent price discovery mechanisms supporting market participants across all segments.

How has the volatility and risk level of the cryptocurrency market in 2026 changed compared to previous years?

2026 crypto market volatility decreased significantly versus 2025, driven by market maturation and clear regulatory frameworks. Bitcoin and Ethereum liquidity strengthened substantially, creating a more stable overall market environment with reduced investment risk levels.

Which emerging cryptocurrency projects entered the top 100 market cap in 2026? What are their growth drivers?

Bitcoin, Ethereum, Ripple, Cardano, and Solana rank among top performers. Growth drivers include regulatory clarity, technological upgrades, institutional adoption, and ecosystem expansion fueling mainstream acceptance.

How is the geographic distribution of the cryptocurrency market in 2026? What are the respective proportions of trading volume in Asia, Europe, and North America?

In 2026, North America leads by market value with the United States at the forefront, while Europe and Asia show rapidly growing market shares. All three regions demonstrate strong competitive positioning in the global crypto ecosystem, with Asia and Europe experiencing accelerated growth trajectories.

* As informações não se destinam a ser e não constituem aconselhamento financeiro ou qualquer outra recomendação de qualquer tipo oferecido ou endossado pela Gate.

Partilhar

Conteúdos

Trading volume analysis: 24-hour and 7-day performance across major digital assets

Liquidity assessment and exchange coverage: market depth and accessibility evaluation

FAQ

Artigos relacionados
What is crypto market cap ranking, trading volume, and liquidity overview for January 2026?

What is crypto market cap ranking, trading volume, and liquidity overview for January 2026?

# Article Introduction This comprehensive guide examines cryptocurrency market dynamics in January 2026, analyzing market cap rankings, trading volumes, and liquidity metrics across major digital assets. Bitcoin and Ethereum dominate with combined valuations exceeding $2 trillion, while stablecoin circulation surges to $310 billion, reflecting institutional adoption. Trading volumes reach record daily peaks of $150+ billion on leading platforms including Gate, demonstrating unprecedented market maturity. The article addresses critical concerns for investors and traders: understanding market cap distribution, assessing liquidity depth, and evaluating institutional participation impacts. Through detailed analysis of order book dynamics, bid-ask spreads, and price discovery mechanisms, this guide equips both retail and institutional participants with actionable insights for navigating crypto markets' institutional-grade infrastructure evolution.
2026-01-04 02:03:18
What is the current cryptocurrency market overview by market cap, trading volume, and liquidity in 2026?

What is the current cryptocurrency market overview by market cap, trading volume, and liquidity in 2026?

This article provides a comprehensive cryptocurrency market overview for 2026, examining market capitalization rankings, trading volume dynamics, and liquidity metrics across major exchanges. Bitcoin maintains dominance with approximately 60% market share, while Ethereum ranks second, together accounting for over 80% of total market cap. The analysis covers 24-hour and 7-day trading volume trends, revealing market health indicators and investor participation patterns. Key assets like RAVE demonstrate substantial liquidity with multi-exchange coverage, particularly on Gate with $2.5M daily trading volume. The article assesses liquidity hierarchies, exchange accessibility rates, and market depth metrics, highlighting how institutional adoption and regulatory clarity have strengthened overall market infrastructure. FAQs address market capitalization trends, trading volumes exceeding $150 billion daily, and liquidity improvements compared to previous years, offering traders and investors actionable insights for n
2026-01-09 03:58:40
What is the crypto market overview in 2026: market cap rankings, trading volume, liquidity and exchange coverage explained

What is the crypto market overview in 2026: market cap rankings, trading volume, liquidity and exchange coverage explained

This comprehensive guide examines the 2026 cryptocurrency market landscape, analyzing market cap rankings dominated by Bitcoin and Ethereum, alongside institutional-driven tokenomics shifts. The article explores circulating versus total supply dynamics across major assets like Solana, Cardano, and Polkadot, revealing how burn mechanisms reshape valuations. Trading volume analysis covers both 24-hour and 7-day liquidity patterns essential for understanding real-time market sentiment. Exchange coverage across Gate and other major platforms highlights liquidity distribution disparities, with detailed metrics on accessibility and trading pair diversity. The content provides actionable insights for investors assessing cryptocurrency health through market cap correlations, trading volumes, and exchange presence, while addressing key considerations about liquidity risks and market position sustainability in 2026's matured crypto ecosystem.
2026-01-13 02:57:34
How Has the Crypto Market Volatility Affected Price Movements in 2025?

How Has the Crypto Market Volatility Affected Price Movements in 2025?

This article examines the impact of heightened cryptocurrency market volatility on price movements in 2025, focusing on Bitcoin's milestone of $125,000 and Ethereum's $15,000 target. It explores the synchronized patterns between major cryptocurrencies, highlighting the role of derivative trading and institutional adoption. Additionally, the piece addresses altcoin fluctuations, marked by dramatic swings due to macroeconomic factors and market sentiment. Designed for investors and market analysts, the analysis helps identify trends and risk management strategies amid evolving regulatory landscapes. Keywords such as "Bitcoin," "Ethereum," "volatility," and "market dynamics" enhance readability and relevance.
2025-11-28 01:20:58
How is the Crypto Market Performing in 2025: A Comprehensive Overview

How is the Crypto Market Performing in 2025: A Comprehensive Overview

The article provides an in-depth analysis of the crypto market's performance in 2025, focusing on top cryptocurrencies by market cap, trading volumes, liquidity, and token distribution metrics. It addresses the need for insights into the market dominance of leading digital assets like Bitcoin and Ethereum. The structure includes evaluations of market capitalization, liquidity across exchanges such as Gate, and supply ratios, offering valuable information for investors and traders. Key themes like cryptocurrency dominance, liquidity, and market accessibility are discussed to aid strategic investment decisions.
2025-11-09 02:40:17
What is the global crypto market overview in 2026: market cap rankings, trading volume, and liquidity analysis?

What is the global crypto market overview in 2026: market cap rankings, trading volume, and liquidity analysis?

# Global Crypto Market Overview in 2026: Market Cap Rankings, Trading Volume, and Liquidity Analysis This comprehensive analysis examines the 2026 cryptocurrency landscape, revealing how Bitcoin and Ethereum maintain dominant positions through institutional adoption and regulatory clarity. The article provides essential market intelligence covering multi-trillion-dollar valuations, daily spot trading volumes exceeding $100 billion across major exchanges including Gate, and circulation supply dynamics across 500+ trading platforms. Designed for institutional investors, crypto analysts, and market participants, this guide addresses critical questions about market cap rankings, liquidity infrastructure, and emerging asset distribution across North America, Europe, and Asia. By analyzing stablecoin infrastructure, exchange coverage rates, and trading volume metrics, readers gain actionable insights into 2026's institutional-grade crypto market maturity. The article progresses logically from market dominance asse
2026-01-02 03:45:37
Recomendado para si
What is TEXITcoin (TXC) market overview: price, trading volume, and market cap analysis

What is TEXITcoin (TXC) market overview: price, trading volume, and market cap analysis

This comprehensive market overview examines TEXITcoin (TXC), a Texas-themed Layer 1 blockchain token currently trading at $1.1399 with moderate market activity. The article analyzes TXC's 24-hour trading volume of $76.45K, market cap positioning, and multi-exchange accessibility on platforms like Gate. With 22.79 million circulating tokens and 353.40 million total supply, TEXITcoin demonstrates structured tokenomics supporting long-term sustainability. The analysis covers price volatility patterns, liquidity metrics across 11 active trading pairs, and exchange coverage impact on market depth. Essential for investors evaluating TXC's investment profile, this guide provides crucial data on market dynamics, trading accessibility, and historical performance context within the evolving cryptocurrency ecosystem.
2026-01-13 06:45:16
How Active is Dogecoin Community and Ecosystem in 2026: 5M Twitter Followers, 30% Engagement Growth, and 50+ DApps

How Active is Dogecoin Community and Ecosystem in 2026: 5M Twitter Followers, 30% Engagement Growth, and 50+ DApps

This article examines Dogecoin's vibrant community ecosystem in 2026, showcasing three pivotal growth metrics: 5 million Twitter followers reflecting 20% annual growth, 30% engagement surge driven by interactive DApps and developer contributions, and 50+ decentralized applications spanning payment, security, and DeFi sectors. The analysis demonstrates Dogecoin's evolution from meme-asset origins toward genuine utility through ecosystem maturation. Ideal for investors, community members, and blockchain enthusiasts seeking insights into ecosystem health, community dynamics, and Dogecoin's competitive positioning within the broader cryptocurrency landscape. The article traces how social media dominance translates into sustainable engagement, how developer contributions strengthen ecosystem foundations, and how diversified DApp infrastructure supports long-term value proposition and user adoption across Gate and other platforms.
2026-01-13 06:42:57
What is Zebec Network (ZBCN) market cap and trading volume in 2026

What is Zebec Network (ZBCN) market cap and trading volume in 2026

Zebec Network (ZBCN) maintains a market capitalization of $283-294 million, ranking approximately #140-144 globally as of January 2026. With 96.91 billion tokens circulating from a 100 billion total supply, ZBCN demonstrates mature token distribution with minimal dilution potential. The token exhibits strong trading activity, recording $6.88-10.42 million in 24-hour volume and achieving a 17.60% price increase over seven days at approximately $0.0028 USD. ZBCN is actively traded across major exchanges including Gate, Huobi, and OKX, with Huobi commanding 26.86% of total trading volume. This multi-exchange liquidity framework ensures efficient price discovery and accessibility for global traders. The article comprehensively examines ZBCN's market positioning, token economics, trading dynamics, and exchange coverage, addressing investor concerns about valuation, supply dynamics, and market liquidity within the Zebec Network ecosystem.
2026-01-13 06:40:33
What is USDT fundamentals: whitepaper logic, use cases, technology innovation, and roadmap progress explained

What is USDT fundamentals: whitepaper logic, use cases, technology innovation, and roadmap progress explained

This comprehensive guide explores USDT fundamentals as the industry's leading stablecoin with $170 billion market capitalization backed by 1:1 USD reserves. The article examines Tether's Plasma initiative designed to consolidate transaction control and eliminate fees across blockchain networks, transforming USDT from a distributed token into a unified settlement infrastructure. It analyzes USDT's multi-chain dominance strategy generating $13 billion annual revenue across forty-plus networks including Ethereum and TRON, while positioning stablecoins as foundational infrastructure for institutional capital allocation. The 2026 roadmap consolidates $150 billion USDT supply into a zero-fee settlement layer with cross-chain Bitcoin integration, establishing unprecedented liquidity pathways. Additionally, the guide addresses technical architecture, reserve management mechanisms, comparative advantages versus USDC and DAI, security best practices, and resolves key controversies surrounding reserve transparency. Idea
2026-01-13 06:38:30
What is the current USDT market cap and trading volume in 2026?

What is the current USDT market cap and trading volume in 2026?

This article provides a comprehensive overview of USDT's market dominance in 2026, featuring 186.97 billion tokens in circulation and a market cap approaching $187 billion, representing 60% of the stablecoin sector. USDT demonstrates exceptional trading strength with approximately $79 billion in 24-hour trading volume, maintaining price stability around $0.9988 through robust liquidity mechanisms. The article examines how USDT's multi-chain integration across major blockchain networks enhances liquidity consolidation and reduces fragmentation across decentralized exchanges. Key topics include Tether's position as the third-largest cryptocurrency, institutional adoption drivers, and the effectiveness of reserve backing systems. Ideal for traders, institutions, and crypto investors seeking to understand stablecoin market dynamics and USDT's critical infrastructure role on Gate and other platforms.
2026-01-13 06:36:19
What is token economics model: how does PIPPIN's 90% community allocation and deflationary burning mechanism work

What is token economics model: how does PIPPIN's 90% community allocation and deflationary burning mechanism work

This article explores PIPPIN's innovative token economics model, featuring a community-first approach that allocates 90% of total supply directly to community participants, fundamentally challenging traditional venture-capital-dominated distribution models. The piece examines how PIPPIN's deflationary burning mechanism systematically reduces token supply from 1 billion total, creating scarcity and enhancing long-term value through transparent, irreversible supply reduction. The article details governance implementation via Snapshot, enabling 32,711 token holders to exercise democratic decision-making authority. Additionally, the analysis reveals critical centralization risks: on-chain data demonstrates that approximately 50 associated wallets control 50% of the token supply, contradicting PIPPIN's decentralization narrative. This comprehensive guide addresses how community allocation and deflationary mechanisms work together, their advantages over traditional models, and the potential risks retail investors f
2026-01-13 06:32:38