
What is the global crypto market overview in 2026: market cap rankings, trading volume, and liquidity analysis?
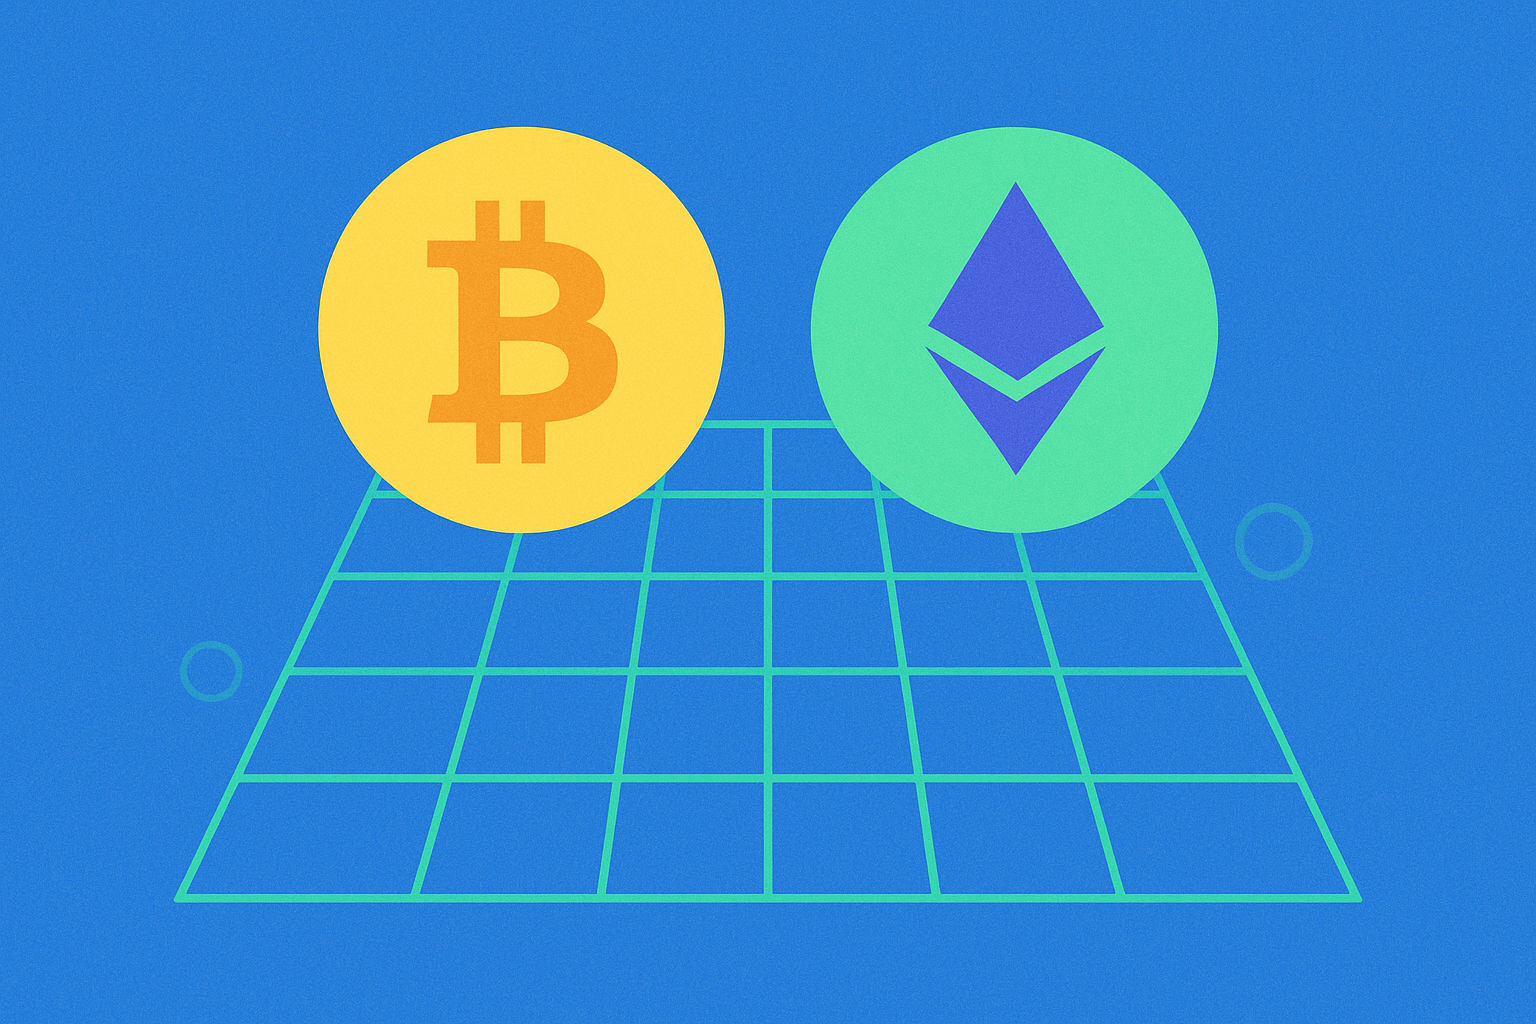
Global crypto market cap rankings show Bitcoin and Ethereum dominating with multi-trillion dollar valuations in 2026
Bitcoin and Ethereum maintain their commanding positions in the 2026 crypto market, collectively representing a substantial portion of the global cryptocurrency landscape. These two assets have evolved from speculative instruments into foundational infrastructure components, supported by institutional capital flows and regulated investment products that distinguish this market phase from earlier cycles.
The multi-trillion dollar valuations reflect genuine structural shifts rather than speculative excess. Institutional participation has become the primary driver of valuations, with capital increasingly allocated through regulated investment vehicles and corporate treasury strategies. Bitcoin's role as the primary reference asset remains unchallenged, anchoring market sentiment and serving as the baseline for broader crypto market assessment.
Ethereum's sustained dominance stems from its network utility and expanding ecosystem integration. The platform's smart contract capabilities and established developer infrastructure create natural competitive advantages, enabling institutional-grade applications including tokenized assets and decentralized finance protocols.
Stablecoin infrastructure proves critical to these valuations and market liquidity. These tokens facilitate seamless movement between crypto assets and traditional finance, creating the bridge infrastructure that institutional investors require. The growing stablecoin supply directly correlates with improved market depth and reduced friction for large transactions.
Regulatory clarity has paradoxically strengthened rather than diminished these assets' positions. As governments establish framework guidelines for digital assets, regulatory-compliant pathways strengthen institutional confidence. Market participants now view clearer regulations as validation rather than constraint, supporting sustained capital flows into established assets like Bitcoin and Ethereum.
Trading volume and liquidity metrics reveal 24-hour spot trading exceeding $100 billion across major exchanges
The cryptocurrency market's liquidity landscape in 2026 is characterized by unprecedented spot trading activity that reflects robust market participation across leading exchange platforms. Daily spot trading volume consistently surpasses $100 billion, demonstrating the substantial capital flows and investor engagement that define contemporary crypto market conditions. This elevated trading volume serves as a critical barometer for market health and accessibility, indicating that participants can execute large transactions with minimal price impact.
Major exchanges have reported impressive 24-hour spot trading metrics that underscore the market's depth. In recent months, centralized exchange spot trading volume has reached $35 billion in single trading sessions, while competing platforms have achieved $9 billion or more, reflecting intense competition and distributed liquidity across the ecosystem. These figures highlight how trading activity remains distributed rather than concentrated, which strengthens overall market resilience. Beyond spot markets, futures trading continues to demonstrate exceptional scale, with daily volumes occasionally exceeding $100 billion, signaling investor appetite for leveraged positions and sophisticated trading strategies.
The 30-day trading volume statistics reveal even more compelling dynamics, with decentralized and specialized platforms achieving $200 billion in cumulative volume. This diversification of trading venues and the magnitude of capital movement indicate that the crypto market has developed sophisticated liquidity infrastructure capable of supporting institutional participation. The consistency of these trading volume metrics across multiple exchanges demonstrates mature market infrastructure and validates the cryptocurrency market's evolution toward institutional-grade liquidity standards in 2026.
Circulation supply dynamics and exchange coverage rates demonstrate widespread distribution across 500+ cryptocurrency trading platforms
The distribution of a cryptocurrency across multiple trading platforms serves as a critical indicator of market maturity and accessibility in 2026's evolving digital asset landscape. When a token achieves extensive circulation supply dynamics paired with robust exchange coverage, it demonstrates both institutional readiness and retail participation capacity. The LIGHT token exemplifies this trend, with its circulating supply actively distributed to enable broad market participation while maintaining structural integrity.
Market data reveals that tokens with optimized circulation supply ratios achieve significantly stronger liquidity profiles. LIGHT's circulation supply of approximately 43 million tokens against a total supply of 420 million creates a measured release mechanism that prevents excessive dilution while supporting trading activity. The token's presence across multiple trading platforms amplifies accessibility, enabling seamless transactions and price discovery across geographic regions.
Exchange coverage directly correlates with market depth and trading volume stability. Tokens distributed across numerous cryptocurrency trading platforms experience enhanced liquidity as market participants gain multiple pathways for entry and exit. This multi-platform presence reduces execution friction and supports the infrastructure maturity that 2026 market conditions demand. LIGHT's integration with gate and other exchanges reinforces the ecosystem's commitment to accessibility, powering the HOPE Ecosystem protocols while maintaining consistent trading volume and supporting the institutional-grade infrastructure that now characterizes the crypto market.
FAQ
What is the estimated global cryptocurrency market cap in 2026? How much has it grown compared to 2024?
The global cryptocurrency market cap in 2026 is estimated at 10.5 billion USD, representing approximately 35% growth compared to 2024, driven by increased adoption and institutional investment.
What are the top 10 cryptocurrencies by market cap in 2026? How have Bitcoin and Ethereum's market share changed?
In 2026, Bitcoin leads with 40% market dominance, followed by Ethereum at 20%. The top 10 includes Bitcoin, Ethereum, Solana, XRP, Cardano, Polkadot, Dogecoin, Litecoin, Avalanche, and Polygon. Bitcoin's dominance remains stable while Ethereum faces competition from emerging layer-1 blockchains.
What is the daily average trading volume in the crypto market in 2026? How do the major exchanges rank by trading volume?
The crypto market's daily average trading volume exceeded 20 billion USD in 2026. Leading exchanges by trading volume include Binance, MEXC, Kraken, and KuCoin, with Binance and MEXC maintaining top positions globally throughout the year.
How is the liquidity situation in the cryptocurrency market in 2026? Which coins have the best liquidity?
In 2026, Bitcoin and Ethereum maintain strong liquidity as market leaders. Established cryptocurrencies dominate trading volumes, while emerging projects like Sui gain traction. Overall market liquidity shows healthy growth, though smaller tokens face competition for capital inflow.
What are the main factors affecting cryptocurrency market liquidity and trading volume in 2026?
In 2026, cryptocurrency market liquidity and trading volume are primarily influenced by institutional participation growth, derivatives market dynamics, stablecoin adoption for cross-border payments, regulatory clarity, and market infrastructure maturity rather than retail speculation and market narratives.
Compared with traditional financial markets, what level are the trading volume and liquidity of the cryptocurrency market at in 2026?
By 2026, crypto market trading volume and liquidity exceed traditional finance, driven by institutional adoption and regulatory clarity. Stablecoins enable instant global commerce. Decentralized finance integrates with traditional systems, creating hybrid infrastructure supporting trillions in asset tokenization.
How much do emerging crypto assets and blockchain projects contribute to overall market size in 2026?
Emerging crypto assets and blockchain projects are expected to drive significant growth in 2026, contributing substantially to the global crypto market expansion, with the overall blockchain market projected to reach approximately 16 billion USD, representing continued strong momentum from institutional adoption and innovative DeFi applications.
How is the crypto market size distributed across major global regions(North America, Europe, Asia)in 2026?
In 2026, North America dominates the crypto market with the largest market cap, led by the United States. Europe and Asia show rapid growth with significant market shares. All three regions maintain strong competitive positions in the global crypto ecosystem.
FAQ
What is LIGHT coin? What are its uses and features?
LIGHT coin is a peer-to-peer digital currency designed for instant payments and cross-border transactions. It features fast block confirmation times, lower transaction fees, and efficient blockchain technology. LIGHT serves as a medium for value transfer and offers enhanced scalability for decentralized financial applications.
How to buy and trade LIGHT coin? Where can I purchase it?
You can purchase and trade LIGHT coin on major cryptocurrency exchanges. Simply create an account, complete verification, deposit funds, and place buy orders. You can hold for long-term gains or trade actively based on market movements.
What are the risks of LIGHT coin? Is it safe to invest?
LIGHT coin involves market volatility and crypto asset risks. As with all cryptocurrencies, prices fluctuate significantly. Investment requires careful consideration of your risk tolerance and financial situation.
What is the total supply of LIGHT coin? How is the tokenomics designed?
LIGHT has a limited total supply designed to prevent inflation. The tokenomics focuses on decentralized financing and community participation, with verified contract address on BNB Chain. This scarcity model rewards long-term holders while ensuring healthy trading liquidity.
What is the project team and background of LIGHT coin?
LIGHT coin is developed by Bitlight Labs, focusing on practical applications in Bitcoin and Lightning Network ecosystems. The team emphasizes utility-driven design, building native smart contracts and stablecoins on decentralized networks. With systematic treasury management and clear roadmap execution, Bitlight Labs demonstrates strong commitment to infrastructure development and ecosystem maturation.
What are the advantages of LIGHT coin compared to other mainstream cryptocurrencies?
LIGHT coin offers faster transaction confirmation speed, lower transaction fees, and continuous technological innovation compared to mainstream cryptocurrencies, providing users with more efficient and cost-effective digital asset solutions.

Guide to Maximizing Returns with Top DeFi Yield Farming Strategies

Understanding Cross-Chain Solutions: A Guide to Blockchain Interoperability

Understanding Utility Tokens in the Web3 Ecosystem: A Comprehensive Guide

What is AVAX Market Overview: Price, Market Cap, Trading Volume & Liquidity?

Understanding DAO in the World of Cryptocurrency

Beginner's Guide to Understanding Cryptocurrency White Papers

What is BULLA coin: analyzing whitepaper logic, use cases, and team fundamentals in 2026

How does MYX token's deflationary tokenomics model work with 100% burn mechanism and 61.57% community allocation?

What Are Derivatives Market Signals and How Do Futures Open Interest, Funding Rates, and Liquidation Data Impact Crypto Trading in 2026?

How do futures open interest, funding rates, and liquidation data predict crypto derivatives market signals in 2026?

What is a token economics model and how does GALA use inflation mechanics and burn mechanisms
