Bear Flag 是什么?深入解析 Bear Flag 在加密货币市场的意义与最新价格动态
Bear Flag 是什么?
在加密货币技术分析领域,Bear Flag(熊旗 / 看跌旗形)是一种常见的图表形态,用于提示当前价格趋势可能继续向下延续的走势。Bear Flag 形态最初见于经典技术分析理论,其名称来源于图形结构像一根旗杆和一个向上盘整的旗帜:价格先急速下跌(旗杆),随后稍作盘整(旗面),最后继续下跌。
对许多交易者来说,Bear Flag 是判断空头趋势是否延续的重要参考,尤其在波动剧烈的加密市场中,这种形态能够揭示短期方向性偏好的延续信号。
Bear Flag 在技术分析中的核心结构
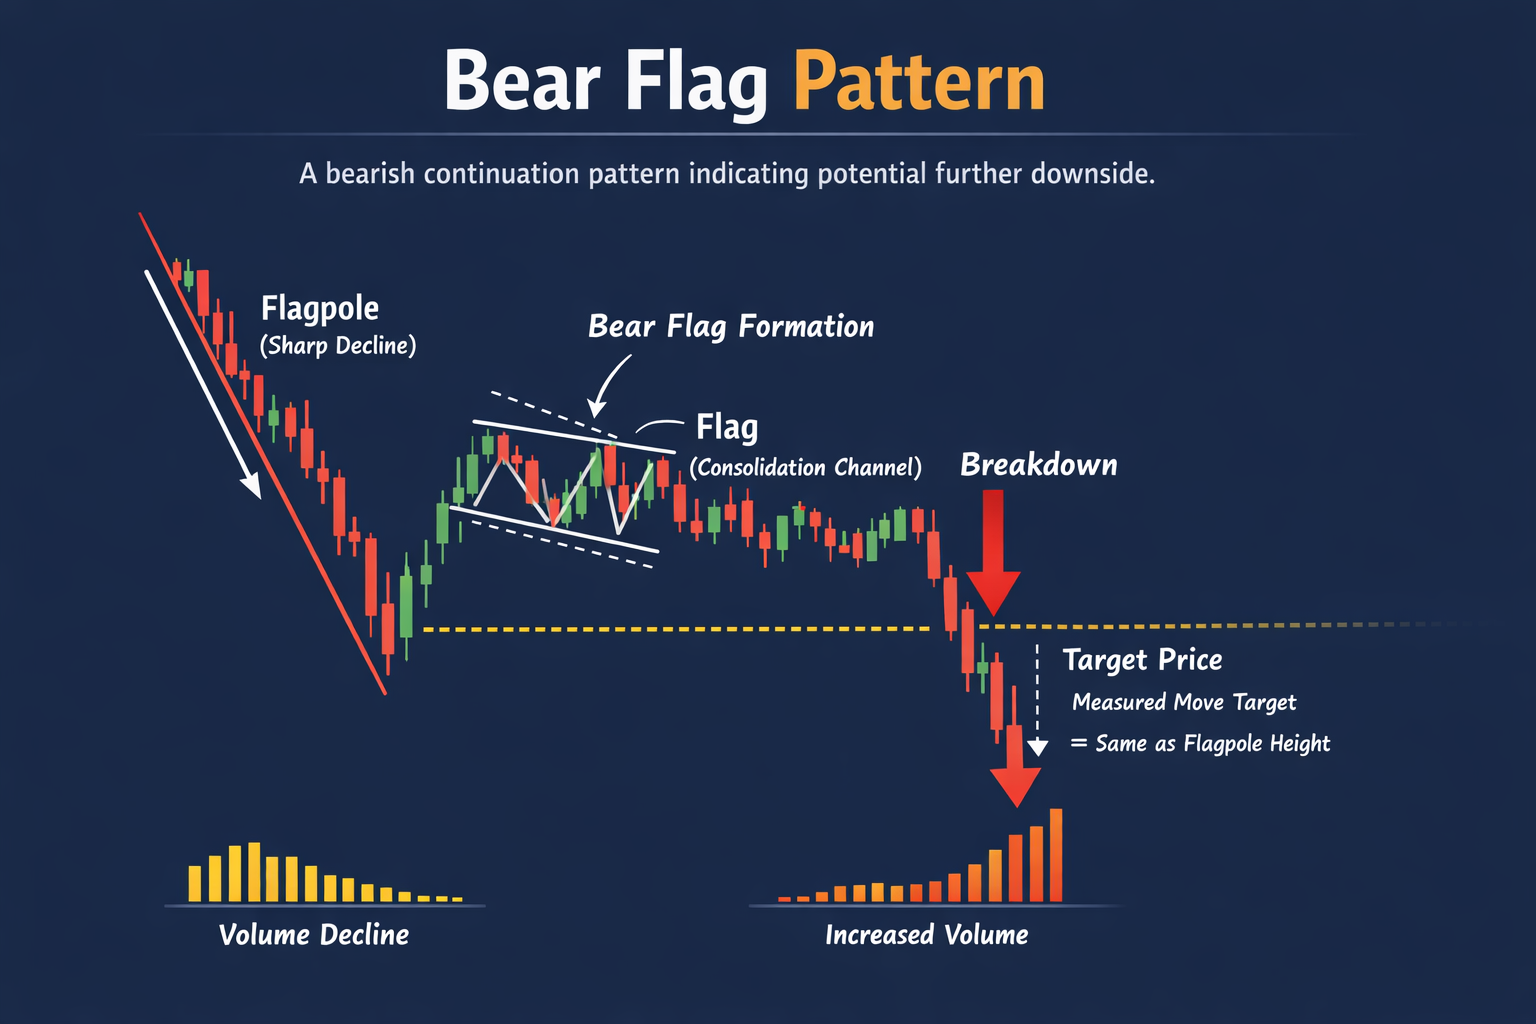
Bear Flag 形态通常由两部分构成:旗杆和旗面。
- 旗杆(Flagpole)指价格快速下跌形成的明显斜率。
- 旗面(Flag)则是在下跌之后的一段价格盘整区间,呈现短期小幅上升或横盘走势。
这种结构反映了市场力量的阶段性变化:空头先猛烈打压价格,但随后买卖双方暂且达成短暂均衡,形成盘整区。若价格随后跌破旗面下沿位置,则视作 Bear Flag 形态确认,预示空头趋势延续。
技术交易者常结合成交量、RSI、均线等指标确认 Bear Flag 的有效性。例如,在 Bear Flag 盘整阶段成交量通常逐渐下降,而下破后成交量回升表明空方力量再度占优。
Bear Flag 如何影响加密货币价格走势
在加密货币市场中,Bear Flag 多被视为“看跌延续模式”。一旦价格从盘整区向下突破,并伴随成交量放大,则可能进入新一轮下跌。
熊旗预测的价格目标通常使用等幅测算法:
- 量测旗杆长度(价格急跌区间)。
- 自破位位置向下投射相同跌幅,得到下一个预期目标。
例如某币从 120,000 美元快速跌至 100,000 美元,形成 20,000 美元的旗杆,若之后盘整破位下跌,则理论上下一波目标可能在 80,000 美元附近。尽管 Bear Flag 并非每次都成功兑现目标,但在动量强劲的下跌行情中常被视作“概率偏向”的交易信号。
比特币最新 Bear Flag 价格动态与分析
近期比特币(BTC)价格在日线与周线图上再次出现 Bear Flag 形态引发市场关注。分析显示,BTC 价格形成了一个明显的下跌旗杆,随后进入相对狭窄的盘整期,这正是 Bear Flag 的典型结构。
根据最新市场分析:
- 有观点认为 BTC 若确认 Bear Flag 破位,下跌目标可能指向约 $76,000 与 $50,000 等关键价位。
- 另一类分析认为若盘整被下破,则 BTC 可能进一步跌向 约 $75,000 左右,并需要重新测试关键支撑。
- 过去分析也曾指出 Bear Flag 形态可能让 BTC 价格下跌至约 $67,000 水平。
这些价格预测并非一致,但反映 Bear Flag 的核心逻辑:若支撑失守,则空头趋势有可能继续深化。
需要注意的是,市场情绪、宏观因素和成交量同样会影响 Bear Flag 的有效性。
Bear Flag 的实战交易策略
对于技术交易者而言,Bear Flag 提供了明确的入场、止损和止盈策略:
- 确认突破后做空:等待价格有效跌破旗面下沿并伴随成交量放大,再建立空头仓位。
- 止损设置:常将止损设于旗面上沿或近期高点之上,以防假突破。
- 止盈目标:通过等幅测算法设定目标价,或结合其他支撑位逐步止盈。
合理的风险控制与仓位管理是 Bear Flag 交易成功的关键。
Bear Flag 的风险与误判注意事项
尽管 Bear Flag 在技术分析中广泛应用,但交易者需注意:
- 假突破:价格可能短期下破后迅速反弹,导致止损触发。
- 震荡行情:在无明显趋势市场中,Bear Flag 的参考价值可能降低。
- 宏观因素影响:如利率政策、监管消息等可能改变市场结构,减弱技术形态信号。
因此,Bear Flag 最适合作为趋势确认的一部分,而非唯一决策依据。
结语:Bear Flag 在加密市场的参考价值
Bear Flag 是技术分析中重要的趋势延续形态,在加密货币市场中尤其常见。结合实时价格动态、成交量与其他指标,可以帮助交易者更科学判断市场走向。但需注意风险与误判可能,避免单一依赖指标制定投资决策。
相关文章

DID 去中心化身份如何推动加密领域新变革 | 区块链与自主身份结合趋势

MathWallet 轻松入门指南

2026 最佳元宇宙项目:抓住下一波数字浪潮