fomox
MarketsPerpsSpotSwap
Meme
Referral
More
Search Token/Wallet
/

Cryptocurrency trading with Japanese candlesticks

2025-12-29 09:22:20
Crypto Trading
Crypto Tutorial
Investing In Crypto
K-line
Spot Trading
Article Rating : 4
60 ratings
Master cryptocurrency trading with Japanese candlesticks. Explore candlestick fundamentals, learn how to interpret them, and analyze trading patterns on Gate. This complete guide delivers practical examples and strategies for both novice and seasoned traders.
Cryptocurrency trading with Japanese candlesticks

Japanese Candlesticks: What Are They, and How Do You Read and Analyze Candlestick Charts?

Japanese Candlesticks: A Beginner’s Guide

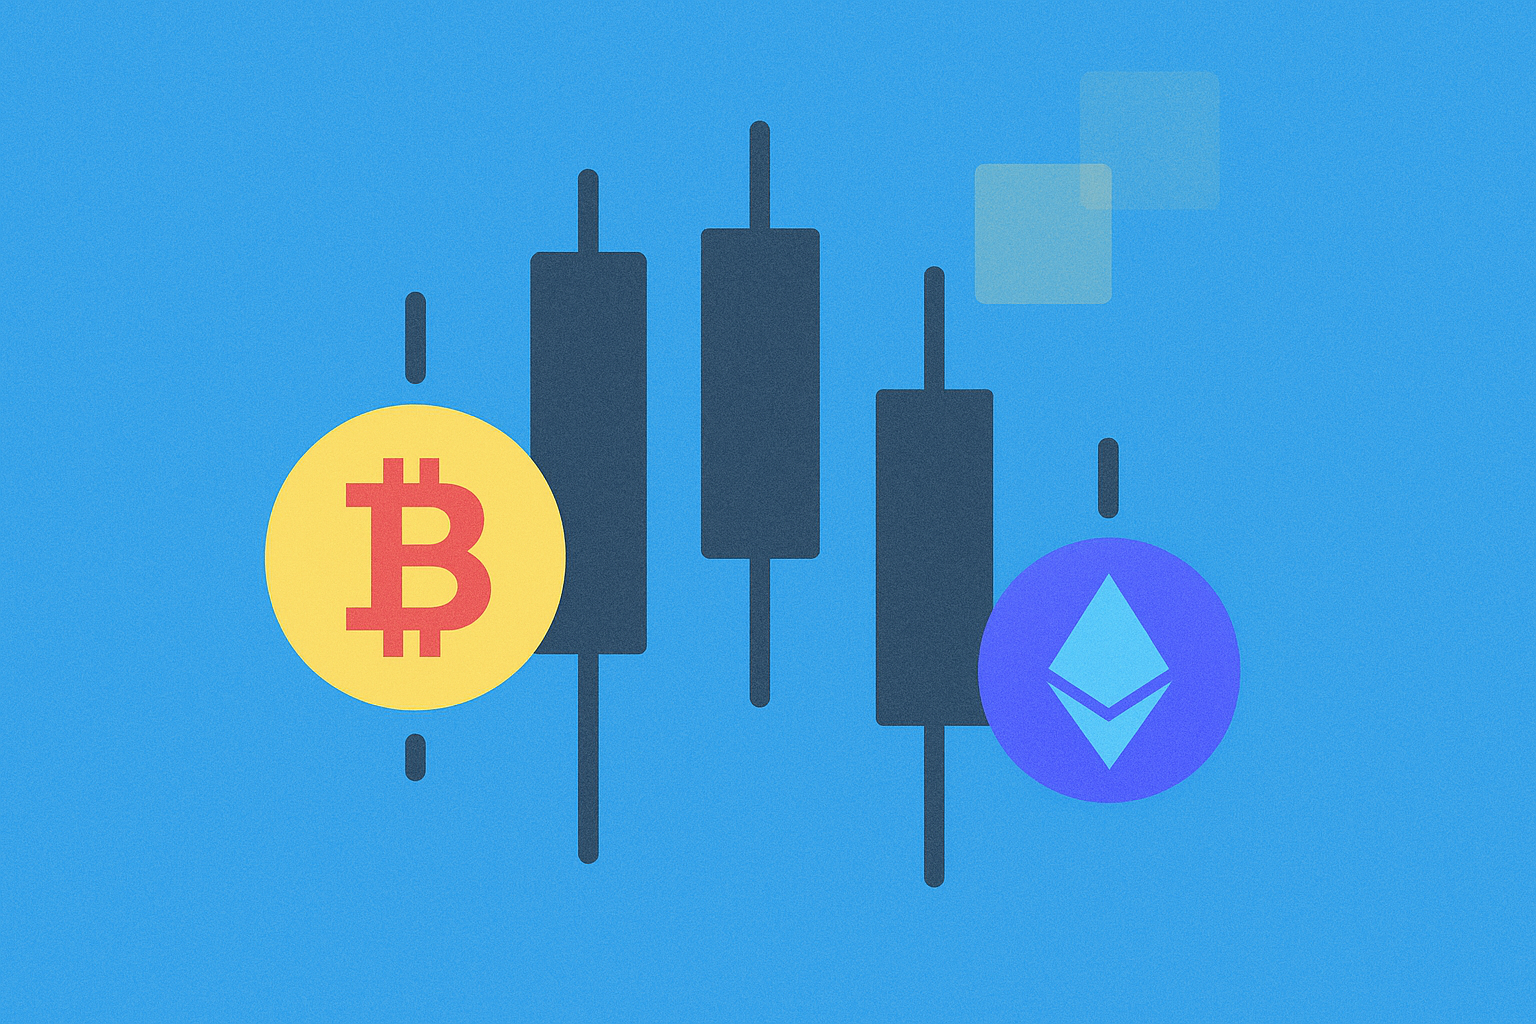
Japanese candlesticks are a visual method for tracking asset price movements on charts. Originating in 18th-century Japan for rice price analysis, this technique is now used across the entire financial sector, including digital asset trading platforms. Each candlestick represents price changes for a specific time period—such as one minute, one hour, one day, or any selected timeframe.

A Japanese candlestick has several essential components. The body is a rectangle that displays the range between the period’s opening and closing prices. A green (or white) body means the closing price is higher than the opening price—a bullish signal. A red (or black) body means the closing price is lower than the opening price—a bearish signal. Wicks (or shadows) are thin lines above and below the body, indicating the highest and lowest prices reached during the period.

For example, on an hourly Bitcoin chart, if the opening price was $42,000 and the closing price was $43,500, the candlestick will be green, with its body spanning the $42,000 to $43,500 range. If the hourly high was $44,000 and the low was $41,500, the wicks will mark those extremes.

Several factors drive the popularity of Japanese candlesticks. First, they’re easy to read—even for traders just starting technical analysis. Second, each candlestick provides a complete and informative snapshot of price action for its period. Third, Japanese candlesticks are highly versatile and can be used to analyze any financial asset—from digital currencies and stocks to commodities and forex pairs.

The Function of Japanese Candlesticks on Charts

Japanese candlesticks play a crucial role in helping traders make informed decisions based on technical analysis. Far from decorative, they offer powerful insights into market behavior.

Their first key function is showing price dynamics. Candlesticks clearly illustrate how an asset’s price changed during a specific timeframe, enabling traders to quickly gauge trend direction—whether it’s bullish (upward) or bearish (downward). The wick’s length indicates volatility: long wicks mean sharp price swings, while short wicks imply relative stability. The candlestick body’s size reflects the strength of market movement—a large body signals strong momentum; a small body points to weak momentum.

Second, candlesticks reflect market psychology. Each candlestick tells the story of market participants’ actions. A long green candlestick means buyers are in control and demand is climbing. A long red candlestick signals sellers dominance and increasing supply. Candlesticks with small bodies and long wicks are especially revealing—they highlight market indecision and fierce competition between bulls and bears over price setting.

Third, candlesticks form the foundation for pattern analysis. Certain combinations create patterns with predictive value for future price direction. Patterns like Hammer, Shooting Star, Bullish Engulfing, and others help traders spot signals for trend reversal or continuation.

How to Read Japanese Candlesticks: Step-by-Step

To leverage Japanese candlesticks effectively in technical analysis, you must learn to interpret them correctly. The following steps outline the analysis process:

Step one: Select the right timeframe. Most platforms offer intervals from one minute to one month. Your choice should match your trading strategy. For short-term trades, use 1-, 5-, or 15-minute timeframes. For medium-term, 1-hour and 4-hour intervals are optimal. For long-term investing and analysis, choose daily, weekly, or monthly charts.

Step two: Analyze the candlestick body. A green body means prices are rising and buyers are active for that period. A red body means prices are falling and sellers are dominant. A small body of any color signals market indecision and a lack of clear direction.

Step three: Evaluate the wicks. A long upper wick indicates buyers tried to push prices higher but failed, causing a retreat. A long lower wick means sellers attempted to drive prices down, but buyers pushed back and prices recovered. If wicks are absent or very short, it suggests a strong trend with little resistance.

Step four: Compare sequences of candlesticks. Examine several consecutive candlesticks. Multiple green candles in a row point to an uptrend. Multiple reds signal a downtrend. Alternating green and red candlesticks reflect sideways movement with no clear direction.

Key Candlestick Patterns: Analysis Essentials

Candlestick patterns are specific combinations of Japanese candlesticks that often predict future price direction. Patterns may involve one, two, or three candlesticks.

Single-candle patterns use only one candlestick. The Hammer pattern features a small body (either green or red) and a long lower wick, signaling a bullish reversal after a downtrend. This pattern suggests sellers drove prices down, but buyers stepped in with strong support, pushing the close far above the low.

The Shooting Star pattern signals the opposite. It has a small body and a long upper wick, pointing to a bearish reversal after an uptrend. Sellers tried to take control, but despite resistance, the close ended far below the period’s high.

The Doji pattern forms when the opening and closing prices are nearly equal, resulting in an almost nonexistent or tiny body. This pattern reveals market indecision and often comes before a sharp move in either direction. Confirmation from the following candlestick is recommended when interpreting Doji.

Two-candle patterns analyze two consecutive candlesticks. The Bullish Engulfing pattern features a red candle followed by a larger green candle that completely engulfs the previous one’s price range—a strong bullish signal, suggesting upward momentum. The Bearish Engulfing pattern is the reverse: a green candle followed by a larger red candle covering the earlier range, signaling a potential price drop.

Three-candle patterns involve three consecutive candlesticks. The Morning Star comprises a red candle, a small candle (often a Doji), and a green candle—indicating a bullish reversal after a downtrend. The Evening Star mirrors this, but in reverse order: green, small, then red, signaling a bearish reversal after an uptrend.

Practical Candlestick Analysis

Applying Japanese candlestick insights to trading requires a structured approach and clear steps.

Step one: Open the price chart for your chosen asset. Select the trading pair and switch to candlestick chart mode.

Step two: Identify the main trend. Use broader timeframes like 4-hour or daily charts. Study the sequence of candlesticks: if green dominates, the trend is upward; if red dominates, it’s downward. Watch the direction of highs and lows as well.

Step three: Search for candlestick patterns. On shorter timeframes such as 1-hour, look for Hammer or Shooting Star patterns for short-term trades. On daily charts, identify Engulfing patterns for longer-term positions.

Step four: Confirm signals with additional indicators. Candlestick analysis is most effective when combined with technical indicators. The Relative Strength Index (RSI) helps validate overbought or oversold conditions. MACD provides insight into trend strength and direction. Support and resistance levels pinpoint optimal entry and exit points.

Step five: Make your trading decision. If you spot a Bullish Engulfing pattern in an uptrend and RSI is rising, that may signal it’s time to open a long (buy) position. If you see a Bearish Engulfing pattern in a downtrend, it may be a signal to open a short (sell) position or close an existing long.

Conclusion

Japanese candlesticks remain one of the most fundamental and effective tools for technical analysis on financial markets. Their enduring popularity comes from simplicity, informativeness, and universal applicability to all asset classes. Mastering candlestick reading and pattern analysis gives traders a competitive edge when making trading decisions. However, Japanese candlesticks deliver the most value when combined with additional technical indicators and sound risk management practices. Ongoing practice and refining analytical skills empower traders to use candlestick analysis successfully in reaching their financial goals.

FAQ

What are Japanese candlesticks in plain language?

Japanese candlesticks are charting tools used to analyze cryptocurrency prices. Each candlestick displays the opening, closing, highest, and lowest prices for a set time period. A green candlestick signals price gains; a red candlestick signals losses. They’re the main tool for forecasting price movements.

What are Japanese candlesticks?

Japanese candlesticks are a graphical method for displaying crypto asset prices over a specific period. Each candlestick shows the opening, closing, high, and low prices. Green means price is rising, red means it’s falling. This tool helps traders analyze trends and make informed trading decisions.

How do you use Japanese candlesticks?

Japanese candlesticks illustrate the opening, closing, high, and low prices for a period. Green signals upward movement; red signals downward movement. Study candlestick patterns to identify trends and entry points when trading cryptocurrencies.

What types of Japanese candlestick patterns are there?

The main Japanese candlestick patterns include: Hammer, Inverted Hammer, Doji Star, Engulfing, Piercing, Cloud Cover, Three White Soldiers, and Three Black Crows. Each pattern can signal potential changes in price direction on the cryptocurrency market.

* The information is not intended to be and does not constitute financial advice or any other recommendation of any sort offered or endorsed by Gate.

Share

Content

Japanese Candlesticks: A Beginner’s Guide

The Function of Japanese Candlesticks on Charts

How to Read Japanese Candlesticks: Step-by-Step

Key Candlestick Patterns: Analysis Essentials

Practical Candlestick Analysis

Conclusion

FAQ

Related Articles
Moving Average Convergence Divergence (MACD Indicator) │ Technical Analysis in Cryptocurrency Investing

Moving Average Convergence Divergence (MACD Indicator) │ Technical Analysis in Cryptocurrency Investing

A beginner's guide to MACD signal utilization. This tutorial covers how to identify Golden Cross and Dead Cross patterns, strategies for effective application, and methods for integrating MACD with other technical indicators. Master MACD signal analysis to strengthen your crypto trading on Gate.
2026-01-04 03:04:17
Moving Average Convergence Divergence (MACD Indicator) | Applying Technical Analysis in Cryptocurrency Investment

Moving Average Convergence Divergence (MACD Indicator) | Applying Technical Analysis in Cryptocurrency Investment

A comprehensive beginner’s guide to the MACD indicator. Explore fundamental concepts like the golden cross, dead cross, and divergence, along with actionable trading strategies. Discover in detail how to apply the technical analysis techniques required for cryptocurrency investing using Gate.
2026-01-05 12:19:00
MACD指標是什麼?

MACD指標是什麼?

本文深入探討MACD指標(平滑異同移動平均線指標),此為加密貨幣交易中最常用的趨勢追蹤工具。文章系統介紹MACD的三個核心組成元素(快線DIF、慢線DEA及柱狀圖),闡述黃金交叉與死亡交叉的形成機制與實戰應用,並深度解析背離現象、柱狀圖變化及零軸位置等進階技巧。無論您是在Gate進行短線波段操作或中長期投資,本指南均提供完整策略框架與風險管理建議,幫助您精準識別買賣時機,優化交易決策。
2026-01-11 23:22:33
Decoding the KDJ Indicator: A Comprehensive Guide

Decoding the KDJ Indicator: A Comprehensive Guide

"Decoding the KDJ Indicator" is a comprehensive guide for traders and analysts, focusing on the KDJ as a short-term analysis tool in financial markets. It explains the indicator's components: K-line, D-line, and J-line, and their roles in identifying overbought and oversold conditions. The article highlights key usage rules and signals like Golden and Death Crosses, and divergence detection. It also discusses the practical application of KDJ in day trading and crypto markets, guiding readers on decision-making with it and addressing FAQs for deeper understanding. Suitable for traders seeking clearer insights into price movements and market sentiment.
2025-11-26 09:10:48
Understanding Bullish Candlestick Patterns for Effective Trading Strategies

Understanding Bullish Candlestick Patterns for Effective Trading Strategies

Understand bullish candlestick patterns and enhance trading strategies by decoding market trends. This article covers what candlestick patterns are, focusing on bullish, bearish, and continuation patterns to identify market sentiment. Readers will learn how to read and apply these patterns, benefiting both novice and experienced traders. Structured logically, each section builds understanding, culminating in a comprehensive view to inform trading decisions effectively. Keywords like candlestick patterns, bullish trends, and market sentiment are optimized for quick readability and scanning.
2025-10-29 08:17:49
How to Interpret MACD and RSI Signals for Cryptocurrency Trading?

How to Interpret MACD and RSI Signals for Cryptocurrency Trading?

This article offers a comprehensive guide to interpreting MACD and RSI signals, essential for optimizing cryptocurrency trading strategies. It explores the fundamentals of these indicators and their application in analyzing trends and momentum. The piece addresses the challenges of false signals by integrating volume analysis, providing a robust trading framework. Targeted at traders, especially those in Gate, the article enhances decision-making by combining technical indicators and market data effectively. Keywords such as MACD, RSI, and volume are emphasized for readability and quick understanding.
2025-12-04 03:56:42
Recommended for You
How to Evaluate Crypto Community and Ecosystem Activity: Twitter Followers, Developer Contributions, and DApp Growth in 2026

How to Evaluate Crypto Community and Ecosystem Activity: Twitter Followers, Developer Contributions, and DApp Growth in 2026

This article provides a comprehensive framework for evaluating cryptocurrency community and ecosystem health across four critical dimensions. It analyzes social media reach through Twitter and Telegram follower growth as primary community indicators, examining both engagement frequency and sentiment across platforms. The guide tracks developer ecosystem strength via GitHub repository activity and code contributions, revealing project sustainability and technical momentum. Additionally, it evaluates DApp market expansion by measuring transaction volume and user adoption rates on trading venues like Gate. By combining these multifaceted metrics—social presence, developer momentum, and on-chain activity—readers can distinguish authentic grassroots adoption from inflated vanity metrics, making informed investment decisions based on genuine ecosystem vitality rather than surface-level indicators.
2026-01-12 05:13:10
What is cryptocurrency regulatory compliance and why does it matter for investors in 2026

What is cryptocurrency regulatory compliance and why does it matter for investors in 2026

Cryptocurrency regulatory compliance has become a critical investment consideration in 2026, driven by a 340% increase in SEC enforcement actions and heightened institutional scrutiny. This comprehensive guide examines four fundamental compliance challenges: the direct correlation between exchange audit transparency gaps and 67% of investor losses, KYC/AML implementation costs consuming 15-20% of platform budgets, and $2.8 trillion in market uncertainty from cross-border regulatory fragmentation. The article provides actionable insights on selecting compliant trading platforms like Gate, understanding jurisdictional differences across major regions, and implementing enterprise-level compliance frameworks. Investors learn how regulatory compliance transforms from operational burden into competitive advantage, influencing capital allocation and institutional adoption strategies throughout 2026's evolving digital asset landscape.
2026-01-12 05:11:31
What is the fundamental analysis of cryptocurrency projects: whitepaper logic, use cases, technical innovation, and team background explained

What is the fundamental analysis of cryptocurrency projects: whitepaper logic, use cases, technical innovation, and team background explained

This comprehensive guide explains cryptocurrency fundamental analysis through four essential pillars. First, whitepaper evaluation reveals a project's technical architecture and value proposition, examining how innovations like chain abstraction solve real ecosystem problems. Second, real-world use cases demonstrate practical adoption through metrics like trading volume and user engagement—projects like VOOI aggregating perpetual contracts, spot trading, and yield markets exemplify genuine market solutions. Third, technical innovation assessment focuses on breakthrough technologies creating sustainable competitive advantages, from chain abstraction eliminating bridge complexity to unified trading interfaces serving diverse trader needs. Finally, team credentials evaluation examines leadership experience, track records, and execution capability through roadmap delivery performance. Together, these factors—whitepaper quality, adoption metrics, technological differentiation, and team execution—provide investors
2026-01-12 05:09:51
XEN Crypto and Major Wallet Platform Collaboration: Pioneering Gas Subsidy Initiative

XEN Crypto and Major Wallet Platform Collaboration: Pioneering Gas Subsidy Initiative

This article explores how to optimize XEN token minting costs through strategic gas subsidy programs. XEN Crypto, launched in 2022, has achieved significant adoption with over 2 million Ethereum wallets claiming tokens. The platform's partnership with major wallet providers introduces GASU, a universal gas token reducing transaction fees across multiple blockchains including Ethereum, Polygon, BNB Chain, Fantom, and Avalanche-C. Key benefits include seamless wallet integration, cloud-based GASU storage, and multi-chain support that eliminates friction in blockchain interactions. Participants can access subsidies by holding XEN tokens and completing transactions during campaign periods. This collaboration democratizes cryptocurrency access by addressing transaction costs—a primary pain point for new users—while strengthening community engagement and ecosystem growth through innovative technical features and transparent security practices.
2026-01-12 05:09:05
What impact do cryptocurrency regulatory compliance and KYC/AML policies have on crypto market adoption in 2026

What impact do cryptocurrency regulatory compliance and KYC/AML policies have on crypto market adoption in 2026

This article examines how cryptocurrency regulatory compliance and KYC/AML policies shape market adoption by 2026 through four critical dimensions. SEC enforcement actions establish compliance frameworks that paradoxically accelerate institutional participation on regulated platforms like Gate, creating transparent operational environments. Stricter KYC/AML requirements impose significant compliance costs that create barriers for retail users while strengthening institutional confidence through enhanced audit standards and financial transparency. The market bifurcates into compliance-driven platforms capturing institutional capital and decentralized alternatives serving privacy-focused communities. By 2026, regulatory clarity and transparent disclosure mechanisms become competitive advantages, with compliant exchanges experiencing measurable capital inflows and sustained adoption growth, fundamentally transforming cryptocurrency from speculative assets into mainstream financial instruments requiring instituti
2026-01-12 05:08:15
Unlock Spending Flexibility with Advanced PayFi Solutions

Unlock Spending Flexibility with Advanced PayFi Solutions

This comprehensive guide explores PayFi, a revolutionary payment solution that transforms cryptocurrency into practical everyday spending tools. Discover three groundbreaking features: Pay Direct enables seamless online shopping at 300+ merchants including Amazon and Steam; Scan to Pay integrates QR code technology for physical transactions with real-time currency conversion; Tap to Pay provides a physical Mastercard-backed card requiring no credit checks. The article demonstrates real-world applications across cross-border gifting, international travel, and merchant payments while addressing security through multi-layer authentication. Learn how PayFi bridges Web3 and traditional commerce, making cryptocurrency spending as convenient as conventional payment methods while maintaining blockchain advantages. Perfect for users seeking accessible, fee-transparent crypto payment solutions.
2026-01-12 05:07:28