What Is Driving GLM Price Volatility: Analysis of Support Resistance and Market Correlation in 2026
GLM Price Dynamics in 2026: Current Trading Range from $0.199654 to $0.390 USDT
As of January 2026, GLM token operates within a clearly defined trading corridor that reflects both buyer and seller sentiment in the market. The current price stands at $0.3402 USDT, representing an important position within the established support and resistance boundaries that characterize this period. The lower support level anchors at $0.199654 USDT, while the upper resistance barrier sits at $0.390 USDT, creating a trading range that spans nearly 96% from bottom to top.
The current GLM price positioning demonstrates meaningful strength relative to the support zone. Trading approximately 70% above the lower boundary, the token has demonstrated bullish momentum throughout early 2026. This trading range reflects the equilibrium between buyers defending the support level and sellers contesting the resistance threshold. Recent performance underscores this dynamic—GLM surged 22.72% over the preceding seven days and 55.69% over the past month, indicating sustained upward pressure. The trading volume accompanying these movements, exceeding 852,000 USDT daily, validates the authenticity of price movements within this established range. Understanding where GLM trades relative to these support and resistance levels provides crucial context for comprehending the broader volatility patterns that will be examined throughout this analysis.
Support and Resistance Levels: Identifying Key Price Barriers and Technical Breakpoints
Understanding price barriers requires recognizing how support and resistance levels function as critical decision zones in technical analysis. These key price levels represent areas where GLM encounters buying or selling pressure that influences market movement patterns. Professional traders use support levels to identify where pullback stabilization may occur, with GLM's identified pullback support providing a critical foundation for downside protection in trading strategies.
Resistance levels act as upper price barriers where selling interest typically emerges. GLM's first resistance is positioned at 1.4060, representing a significant technical breakpoint where price action historically encounters headwinds. As the decentralized computing platform token, GLM demonstrates how technical breakpoints function across volatile market conditions. The recent price projection toward $0.2896 by January 11, 2026, illustrates how these barriers guide short-term price movements within established resistance frameworks.
Professional traders organize risk management around these technical price levels rather than treating them as absolute price targets. By recognizing confluence zones where multiple technical factors align, traders structure superior entry and stop-loss placement strategies. GLM's identified support and resistance framework enables data-driven decision-making, with anticipated 9.10% monthly gains suggesting upward pressure testing established resistance barriers throughout 2026.
Recent Price Momentum: Analyzing 24-Hour Volatility Patterns and Market Sentiment Shifts
GLM's recent 24-hour price action reveals significant intraday volatility, with the token trading between $0.3192 and $0.3764, currently hovering at $0.3239 despite a 3.14% pullback. This trading range illustrates the dynamic support and resistance levels that characterize volatile cryptocurrency markets. The wide intraday spread of approximately 1.79% demonstrates how rapidly market sentiment shifts can drive price momentum throughout a single trading session.
Market sentiment data shows a nearly balanced outlook with 50.49% positive versus 49.51% negative positioning, reflecting the uncertainty typical of consolidation phases. However, this recent pullback occurs within a remarkably strong weekly context—GLM surged 22.72% over the past seven days, climbing from around $0.218 to above $0.327. The 24-hour volume of $852,381 provides substantial liquidity, enabling traders to execute significant positions without excessive slippage, which historically correlates with sustained price momentum.
The recent volatility patterns suggest market participants are testing key price levels after the strong January rally. Early January 2026 witnessed extraordinary price appreciation, with GLM rallying from $0.218 to $0.332 in mere weeks, establishing momentum that continues attracting institutional and retail interest. This recent 24-hour correction appears relatively modest given the preceding gains, indicating underlying support remains intact as the market consolidates before potentially resuming its upward trajectory aligned with broader market sentiment shifts.
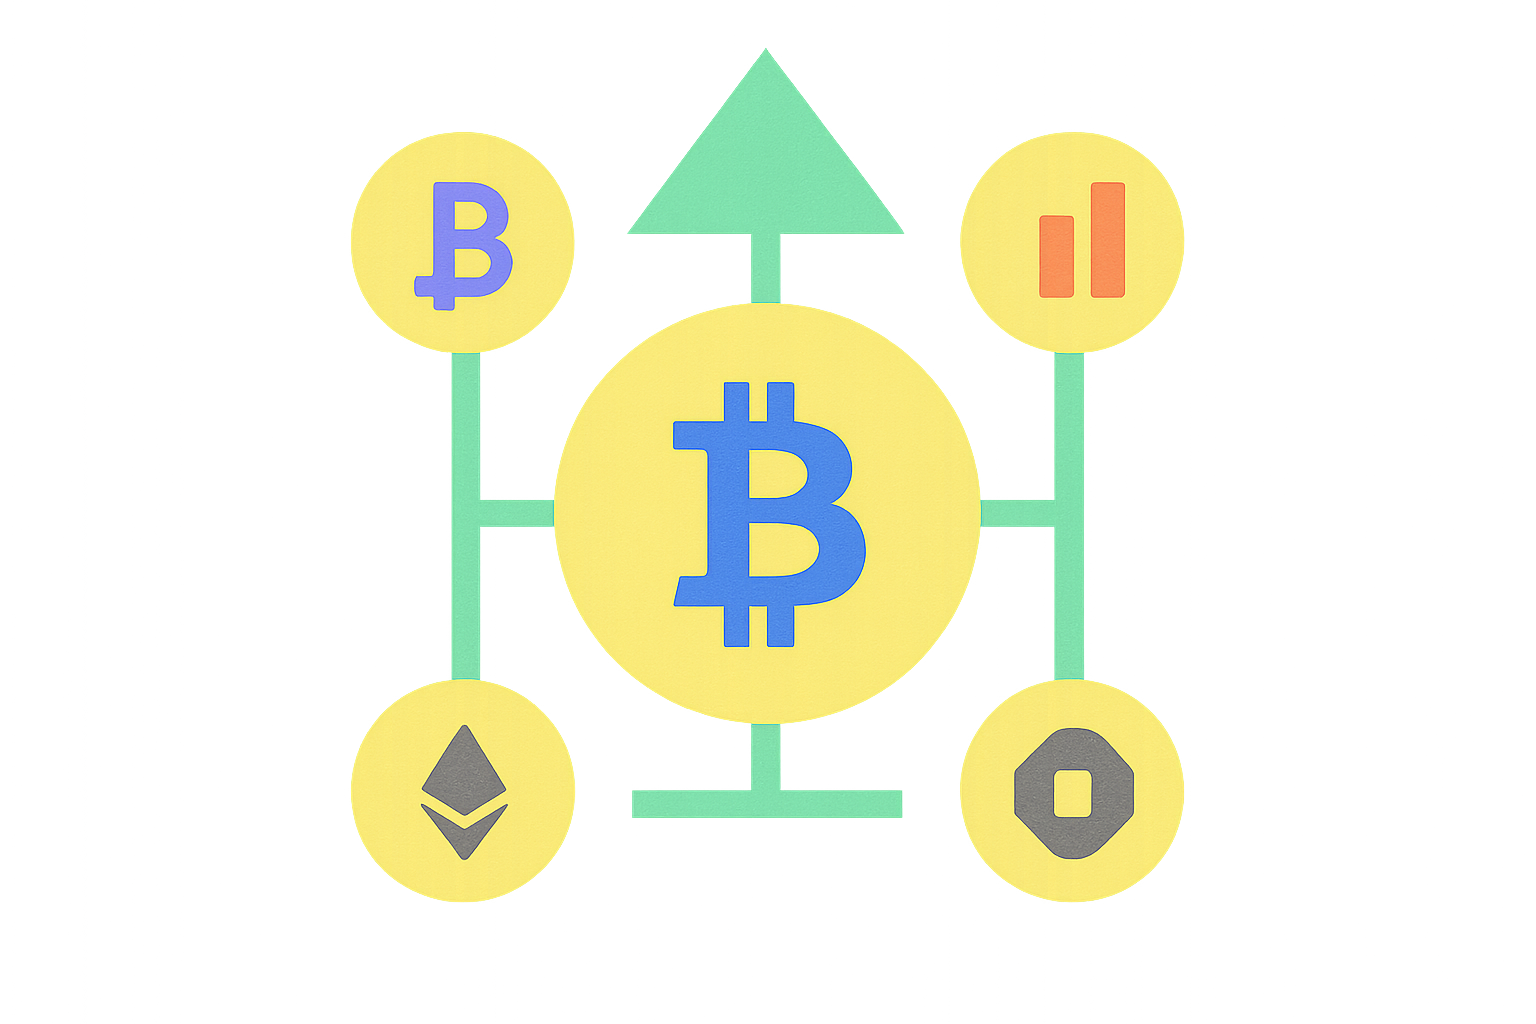
Market Correlation Analysis: Assessing GLM's Linkage with Bitcoin and Ethereum Price Movements
Understanding GLM's relationship with major cryptocurrencies requires examining the quantitative linkage between these digital assets. Historical data from 2017 to 2026 reveals a rolling correlation coefficient of approximately 0.85 between Bitcoin and Ethereum price movements, providing crucial context for analyzing how altcoins like GLM respond to broader market dynamics. GLM exhibits significant sensitivity to Bitcoin's price trajectory, as the leading cryptocurrency often sets the directional tone for the entire digital asset market. When Bitcoin enters price discovery phases or experiences volatility spikes, GLM typically follows suit, though often with amplified price swings due to its smaller market capitalization and lower liquidity.
Ethereum's influence on GLM price movements operates through a different mechanism, particularly given that GLM is built on the Ethereum blockchain. Market structure and liquidity factors substantially impact these correlations. During periods of high trading volume and robust market liquidity across cryptocurrency exchanges, GLM's price movements show stronger synchronization with both Bitcoin and Ethereum. Conversely, low-liquidity environments can cause GLM to decouple from major assets, creating independent price patterns. Event-driven factors—such as regulatory announcements or protocol upgrades affecting Ethereum—directly influence GLM's market behavior. Additionally, the decentralized computing platform's specific use case creates unique correlation dynamics that don't perfectly mirror broader cryptocurrency trends, allowing opportunities for differentiated price movements despite the underlying linkage to Bitcoin and Ethereum price cycles.
FAQ
What are the main factors driving GLM price volatility in 2026?
GLM price volatility in 2026 is primarily driven by supply and demand dynamics, protocol updates, and real-world adoption growth. Market sentiment, trading volume fluctuations, and technological advancements in the Golem network also significantly influence price movements.
How do support and resistance levels affect GLM trading strategy?
Support and resistance levels provide critical price points where GLM reversals or continuations typically occur, enhancing trading signal reliability. Trading near these levels increases the probability of successful trades and improves entry and exit decision-making in GLM positions.
What is the correlation between GLM price movements and major cryptocurrencies like Bitcoin and Ethereum?
GLM price movements show moderate positive correlation with Bitcoin and Ethereum, driven by shared market sentiment and overall crypto market trends. When major cryptocurrencies rally, GLM typically follows, though with varying intensity based on project-specific developments.
What are the key support and resistance levels for GLM in 2026?
Key support level for GLM in 2026 is $0.2232, and resistance level is $0.3307. These levels are crucial for market analysis and trading decisions.
How does market sentiment and macroeconomic factors impact GLM price volatility?
Market sentiment and macroeconomic factors drive GLM price volatility by influencing investor behavior and trading activity. Positive sentiment increases demand and trading volume, while negative sentiment reduces it. Macroeconomic conditions like inflation, interest rates, and economic growth directly affect cryptocurrency valuations and market correlation, creating significant price fluctuations.
What technical indicators are most effective for predicting GLM price movements?
Moving averages and oscillators are most effective for GLM price prediction. When moving averages show strong buy signals and oscillators confirm momentum, they provide reliable entry and exit points for traders analyzing GLM market trends.

What Are the Key Price Support and Resistance Levels for Crypto in 2025?

How Has Bitcoin's Price Volatility Changed in 2025?
# How Does Chainlink (LINK) Price Volatility Compare to Bitcoin and Ethereum in 2025?

What Factors Are Driving the Current Cryptocurrency Price Volatility?

How Has Cryptocurrency Price Volatility Evolved in 2025?
How Has BARD's Price Volatility Affected Its Market Performance in 2025?
How to Find Your Bitcoin Address on Cash App

What Will Shiba Inu Be Worth in 2030?
How to Sell Crypto on Trust Wallet

Is Gold Cheaper in Mexico: Crypto Market Insights
How Much Bitcoin Does BlackRock Own: Latest Data & Insights