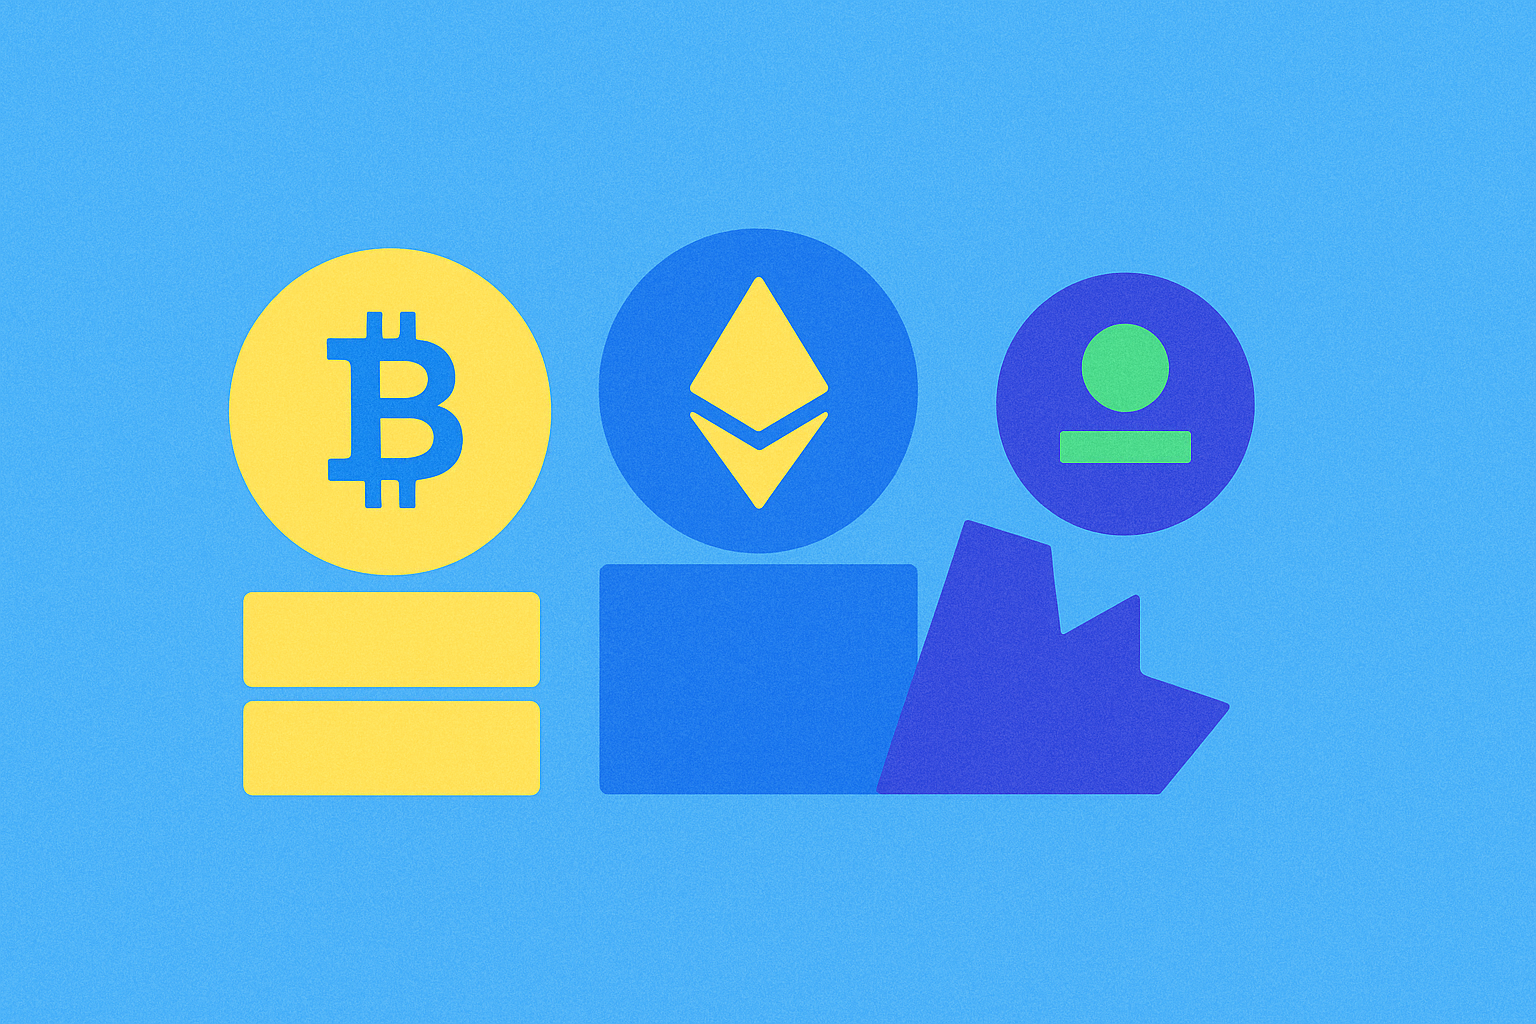
What is token economics model and how do allocation mechanisms, inflation design, and governance utility work in crypto tokens?

Token allocation mechanisms: balancing team, investor, and community distribution for ecosystem sustainability
Effective token allocation mechanisms serve as the foundation for sustainable ecosystem development by strategically distributing supply across stakeholders with distinct roles and incentive structures. A well-designed allocation framework balances competing interests while ensuring long-term protocol viability, preventing premature supply inflation that could undermine token value and community trust.
Successful token projects typically employ structured distribution models that allocate approximately 30-40% to ecosystem growth initiatives, 20-30% for team incentives, 15-25% for early investors, and the remainder for treasury reserves and strategic partnerships. For example, major protocols allocate 30 million tokens toward ecosystem growth including incentive emissions and community initiatives, 20 million for protocol treasury funding development and governance, 20 million for early-stage investors, and 19 million for core team members. This stratification ensures each group receives sufficient motivation while maintaining sustainable tokenomics.
Vesting schedules and milestone-based unlocks function as critical control mechanisms within allocation frameworks. Rather than releasing tokens linearly, modern protocols gate supply releases behind performance indicators and real value creation metrics. This approach incentivizes teams to deliver product milestones, encourages investors to support long-term ecosystem health, and protects community members from dilution caused by speculative early liquidation. By tying token release to measurable outcomes, projects demonstrate commitment to sustainable economics and build confidence among all stakeholder groups.
Inflation and deflation design strategies: managing supply dynamics to maintain token value and market stability
Token supply dynamics fundamentally shape cryptocurrency value retention and ecosystem health. Inflation mechanisms gradually increase circulating supply to incentivize participation and network security, keeping tokens accessible as user bases expand. Conversely, deflation reduces total supply through mechanisms like token burns, creating scarcity that can enhance long-term value preservation. The most effective approach balances both principles through hybrid models that deploy inflationary rewards for immediate growth incentives while incorporating deflationary burns to counteract dilution pressures.
Successful supply management requires aligning design choices with project economics. Fixed supply strategies maximize scarcity for store-of-value narratives, while inflationary designs support sustained network operations. Ethereum exemplifies this balance through its fee-burning model, which removes tokens from circulation while maintaining sufficient emissions for validator rewards. Strategic token burns—whether automated through protocol rules or tied to transaction fees—directly counterbalance inflationary pressure, stabilizing value without sacrificing liquidity. Projects like gate employ similar techniques to maintain equilibrium.
Market stability ultimately depends less on whether mechanisms are inflationary or deflationary and more on whether emissions and burns align with genuine economic utility. When supply dynamics respond to actual demand patterns and network activity rather than following rigid schedules, tokens achieve natural price equilibrium. This alignment between tokenomics design and real-world utility ensures that inflation fuels growth while deflation mechanisms prevent unsustainable devaluation, creating resilient ecosystems where scarcity and accessibility coexist sustainably.
Governance utility and token burn mechanics: leveraging destruction mechanisms and voting rights to drive long-term protocol adoption
Governance utility represents a fundamental incentive mechanism where token holders gain voting power proportional to their holdings, directly influencing protocol decisions and future development directions. This democratic approach transforms passive investors into active stakeholders within the ecosystem, creating meaningful engagement with the project's long-term vision.
Token burn mechanics operate as a deflationary force by permanently removing tokens from circulation. When protocols implement automatic or discretionary burn mechanisms—whether from transaction fees, governance actions, or treasury decisions—they systematically reduce the total supply. This scarcity principle inherently supports price appreciation potential, rewarding long-term token holders and incentivizing users to maintain their positions rather than liquidate them quickly.
The synergy between these mechanisms drives substantial protocol adoption. Holders exercise voting rights to shape governance decisions, align incentives across the community, and approve strategic initiatives. Simultaneously, token burn mechanics signal commitment to long-term value preservation, demonstrating that the protocol actively manages its own tokenomics responsibly. This dual approach builds confidence in the ecosystem's sustainability.
Crypto tokens incorporating robust governance utility alongside deliberate destruction mechanisms create compelling reasons for users to participate beyond speculation. Communities become stakeholders rather than mere traders, as voting rights grant them decision-making power over protocol evolution. The reduction in token supply through burn mechanisms ensures that participating stakeholders benefit from scarcity value appreciation.
Together, governance utility and token burn mechanics form a virtuous cycle. Enhanced voting participation improves decision quality, while deflationary pressures support token value. This combination transforms protocols from centralized platforms into decentralized organizations owned and governed by their communities, ultimately driving sustainable adoption and network effects that strengthen long-term protocol success.
FAQ
What is token economics model and how does it function in cryptocurrency projects?
Token economics model defines how tokens are created, distributed, and utilized. It ensures sustainable growth by incentivizing participants and managing supply through allocation mechanisms, inflation design, and governance utility, directly impacting project success and long-term value.
What are the main types of token allocation mechanisms such as private sales, public sales, airdrops, and mining?
Major token allocation mechanisms include private sales involving institutional investors, public sales open to all participants, airdrops for free token distribution, and mining through computational work. Each serves different purposes in token distribution strategies.
What impact does token inflation design have on a project's long-term value?
Controlled inflation maintains scarcity and utility, supporting long-term value. Excessive inflation erodes trust and reduces investor confidence, while strategic tokenomics design ensures sustainable project growth and ecosystem stability.
What is the governance utility of tokens? How do holders participate in governance decisions through tokens?
Governance tokens empower holders to vote on project decisions, including protocol upgrades, parameter adjustments, and fund allocation. Holders exercise voting rights proportional to their token holdings, directly influencing the project's direction and development.
How to assess whether a token's economic model is healthy and sustainable?
Evaluate token value relative to economic activity and circulation speed. A healthy model demonstrates stable value growth with consistent economic participation, reasonable tokenomics allocation, and balanced inflation design that supports long-term sustainability.
What are the consequences of setting inflation rates too high or too low?
High inflation erodes token value and purchasing power, discouraging holding and increasing price volatility. Low inflation reduces incentives for validators and stakers, slowing network participation and potentially weakening security and ecosystem growth.
Why is the Token Vesting Schedule important?
Vesting schedules are crucial because they prevent early holders from exiting prematurely, ensuring long-term commitment from teams and investors. This maintains project stability and promotes sustainable development by aligning incentives across all stakeholders.
What are the differences in token economic models among different blockchain projects such as Bitcoin, Ethereum, and Solana?
Bitcoin uses PoW with miner rewards. Ethereum and Solana use PoS with validator staking rewards. After Ethereum's transition to PoS, annual inflation decreased significantly, often resulting in deflation. Solana has higher staking ratios but smaller LST market share.

Top Decentralized Exchange Aggregators for Optimal Trading

What is OpenSea? Complete Guide to the Leading NFT Marketplace

Understanding Bitcoin's Supply Limit: How Many Bitcoins Exist?

What Is the Current Market Overview for Cryptocurrencies in December 2025?

How Does On-Chain Data Analysis Reveal Bitcoin Market Trends in 2025?

Layer 2 Scaling Made Easy: Bridging Ethereum to Enhanced Solutions

What do on-chain data metrics reveal about Polygon POL network activity and whale movements in 2026?

How to analyze on-chain data for CRO token: tracking active addresses, transaction value, whale movements, and network fees

How will CRO price volatility evolve by 2030 with support levels at $0.089-$0.090 and 13.6% daily swings
What is Zebec Network (ZBCN) community and ecosystem activity in 2026: Twitter followers, developer contribution, and DApp growth analysis
How do exchange inflows and staking rates affect ZBCN token holdings and capital flows?