Cryptocurrency Fear and Greed Index: Definition, Mechanism, and Online Tracking

What Is the Fear and Greed Index?
A Straightforward Explanation
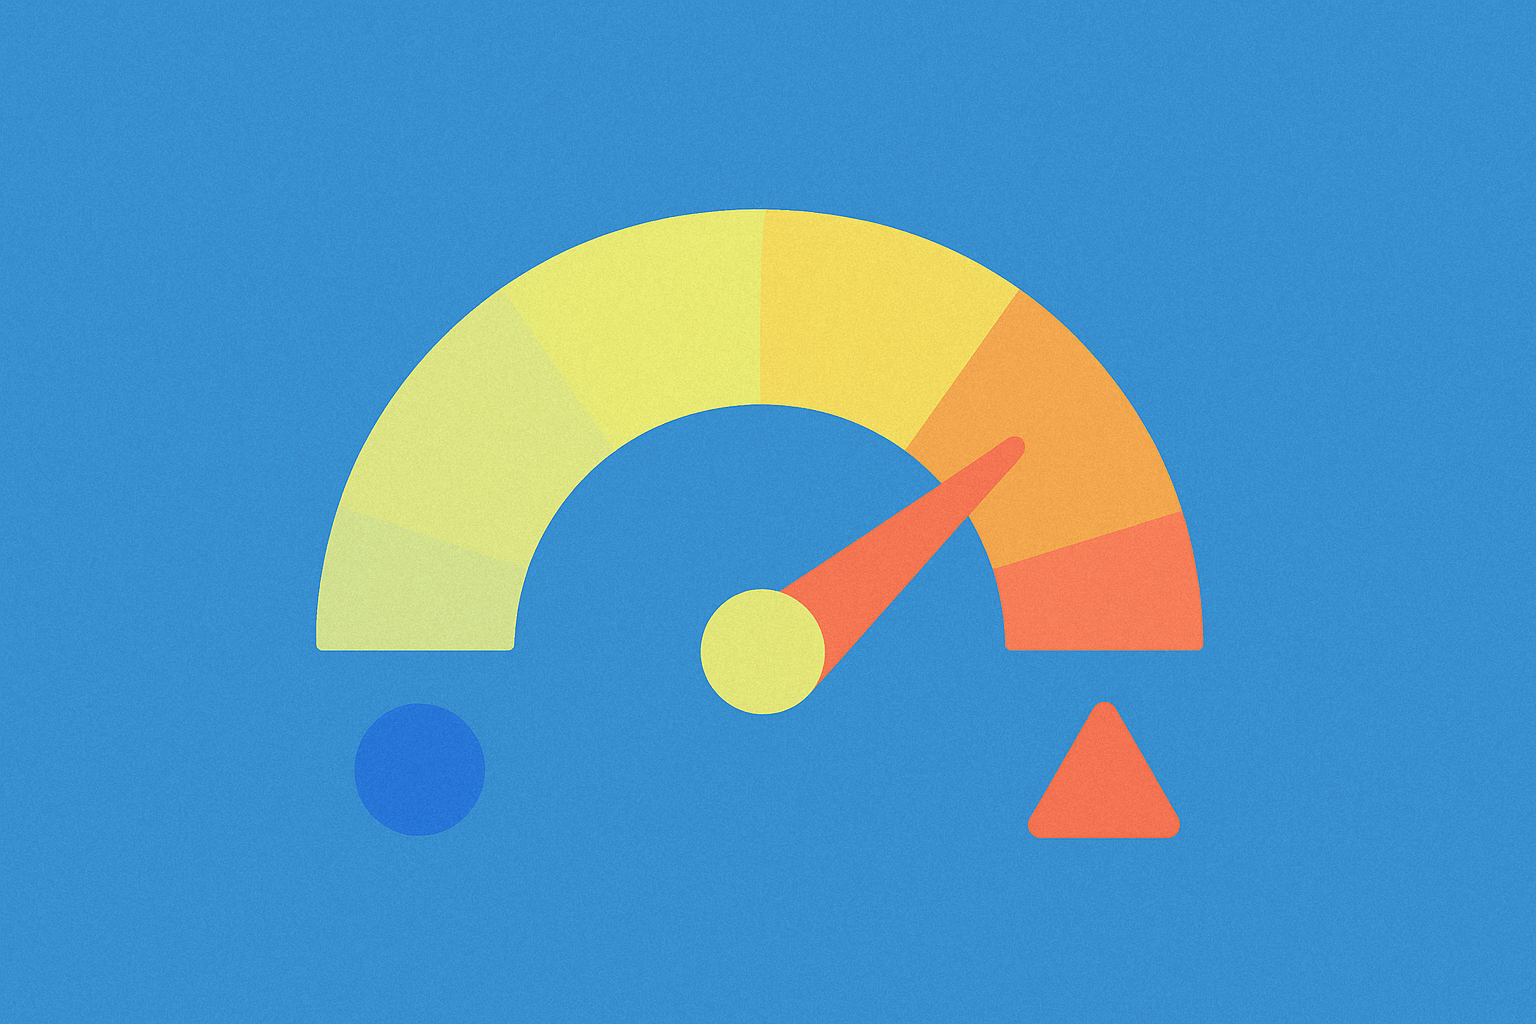
The Fear & Greed Index is a numerical metric that captures the prevailing emotions of cryptocurrency market participants. Originating in traditional finance, where similar indicators are used to analyze stock markets, this tool has been adapted for crypto—especially focusing on Bitcoin (BTC), whose price action often sets the pace for the entire digital asset ecosystem.
The index operates on a 0–100 scale, with each range signifying a specific sentiment:
- 0-24 (Extreme Fear): Signals panic selling and potential undervaluation. Investors exit positions en masse, fearing further declines.
- 25-49 (Fear): The market is cautious, with participants holding back from active buying.
- 50 (Neutral Zone): The market is balanced, showing neither optimism nor pessimism.
- 51-74 (Greed): Participants are actively buying, anticipating further growth.
- 75-100 (Extreme Greed): Indicates an overbought market and a likely correction. Driven by FOMO, investors may overvalue assets.
What Do "Fear" and "Greed" Mean in the Crypto Market?
Fear surfaces in crypto during sharp price drops or negative news. When fear dominates, investors worry about further losses and start mass selling, which lowers demand and prices—often leading to undervalued assets. This oversold state is typically seen by savvy traders as a buy opportunity. Historically, major market turnarounds have frequently begun at moments of extreme fear.
Greed emerges during bull runs when prices surge and traders—driven by euphoria and FOMO—rush to buy at any cost. Rational analysis takes a back seat, and speculative buying pushes assets into overvalued territory. Greed often precedes market corrections, as informed investors take profits, leaving latecomers exposed to losses.
Why Is It Important for Crypto Traders and Investors?
The Fear and Greed Index delivers several vital benefits for market participants:
-
Identifying Market Trends: Low readings (fear) can highlight potential entry points for long-term investments or speculative buys. High readings (greed) may signal it’s time to take profits or exit positions.
-
Managing Emotions: The index helps traders avoid impulsive moves triggered by FOMO (fear of missing out) or FUD (fear, uncertainty, doubt), enabling rational decisions based on objective sentiment analysis.
-
Contrarian Strategies: Skilled traders leverage the index to act against the crowd—buying when fear prevails and selling in times of greed. This echoes the principle, “Be greedy when others are fearful, and fearful when others are greedy.”
-
Risk Management: The index provides signals for overbought or oversold market conditions, crucial for setting stop-losses and sizing positions prudently.
How the Crypto Fear and Greed Index Works
Key Metrics Used in Calculation
The Fear and Greed Index is derived from a multi-factor analysis, with each metric weighted toward the final score:
-
Volatility (25%): Measures current Bitcoin volatility and max drawdowns versus 30- and 90-day averages. High volatility and sharp declines indicate fear; low, steady growth suggests greed and market confidence.
-
Trading Volume (25%): Compares current trading volumes to 30- and 90-day averages. Surging volume in a rising market signals greed; declining volume during drops points to fear and reluctance to participate.
-
Social Media (15%): Analyzes the number and sentiment of Bitcoin and crypto mentions online. Positive, high-activity chatter reflects greed and euphoria, while negative posts, panic, and calls to sell signal fear.
-
Market Surveys (15%): Some platforms survey traders and investors directly, gauging expectations and outlook on market direction.
-
Bitcoin Dominance (10%): The proportion of Bitcoin in total crypto market cap. Rising BTC dominance is a sign of fear—investors moving toward the "safe haven" of Bitcoin. Falling dominance shows greed, as capital flows into altcoins for higher risk and returns.
-
Google Trends (10%): Assesses search queries related to Bitcoin and crypto. Spikes in searches for “buy bitcoin” or “how to invest in crypto” mean greed and FOMO are high; “bitcoin crash” or “sell crypto” signal fear.
Data Sources
The index pulls from a wide array of trusted sources:
-
Market Data: Price, trading volumes, and volatility from leading crypto exchanges and aggregators, covering both spot and derivatives markets.
-
Social Media: Analysis of posts and discussions on X (formerly Twitter), Reddit, Telegram, and crypto forums, using NLP algorithms to gauge sentiment.
-
Search Engines: Google Trends tracks the popularity and shifts in crypto-related searches worldwide.
-
Surveys and Research: Specialized platforms and analytics firms regularly poll market participants to collect qualitative sentiment data.
Index Update Frequency
Most platforms update the index daily at a set time. Some, like CoinStats, refresh every 12 hours, offering near real-time sentiment monitoring. The update cadence depends on how quickly data from different sources are aggregated and processed. Daily updates strike a balance between freshness and filtering out short-term noise.
Where to Track the Fear and Greed Index Online
Popular Platforms
-
Alternative.me: A leading, authoritative source for the crypto Fear and Greed Index. It provides daily BTC index updates, current readings with in-depth explanations, and historical data (7, 30, 90 days, and one year). Its interactive chart lets users visualize sentiment trends alongside BTC price movements. The site also details its calculation methodology and metric weights.
-
CoinMarketCap: The premier crypto tracking platform features its own Fear and Greed Index. It offers standard index charts, an API for developers to integrate data into apps or trading bots, plus extra analytics and news for comprehensive market analysis.
-
CoinStats: Notable for updating the index every 12 hours—twice the standard rate. CoinStats also charts the index not just for Bitcoin but for other major cryptos like Ethereum, and offers seamless integration with mobile apps and widgets for ongoing monitoring.
Tracking on TradingView
TradingView, a popular technical analysis platform, doesn’t include the Fear and Greed Index by default—but traders can still incorporate it:
-
Custom Pine Scripts: Advanced users can write Pine Script indicators to pull index data from Alternative.me or CoinMarketCap APIs and overlay it on TradingView charts alongside other technical tools.
-
Correlated Indicators: TradingView offers tools that track market sentiment indirectly—such as volatility (ATR, Bollinger Bands), trading volume, RSI, and accumulation/distribution indicators.
-
News and Social Sentiment Feeds: TradingView integrates news and community idea streams, which can be used to gauge sentiment and compare with the Fear and Greed Index.
Mobile Apps and Widgets
For traders who favor mobile or want to monitor sentiment on the go, several user-friendly options are available:
-
CoinStats (iOS & Android): The CoinStats app features portfolio and crypto price tracking plus a built-in Fear and Greed Index widget, which can be placed on your phone’s home screen for instant access to sentiment data.
-
Blockfolio (FTX): This crypto portfolio app shows market sentiment and can integrate the Fear and Greed Index, with customizable alerts for specific index levels.
-
HTML Widgets: Sites like Alternative.me offer HTML widgets for embedding the Fear and Greed Index into your own website, blog, or trading dashboard—creating a real-time, personalized info center.
Bitcoin and Crypto Fear and Greed Index Across Market Phases
How the Index Behaves for BTC and Altcoins
The Bitcoin Fear and Greed Index shifts across zones depending on market conditions, macro factors, and news. Historical analysis shows the index tends to hit extremes at key turning points:
-
Extreme Fear (0-24): Common after sharp crashes, negative news (e.g., regulatory bans, exchange hacks, major bankruptcies), or at the tail end of long bear markets. These periods often precede major reversals and new bull cycles.
-
Extreme Greed (75-100): Typical of bull market tops—when media hype is high, new investors flood in, and social channels overflow with bullish sentiment. These phases often end in sharp corrections.
The index for altcoins is less standardized, as most calculations center on Bitcoin as the market leader. Yet altcoin sentiment usually follows BTC due to strong correlation:
-
Rising BTC Dominance: As Bitcoin’s share grows, altcoins often experience fear from capital outflows. Investors seek the perceived safety of Bitcoin during uncertainty.
-
Falling BTC Dominance: When Bitcoin’s share drops, altcoins reflect greed as investors pursue riskier, higher-yield assets—common during “altseason.”
Comparison with Traditional Stock Market
The crypto Fear and Greed Index shares its core concept with the stock market’s CNN Fear & Greed Index, but key differences remain:
-
Volatility: Cryptocurrency markets are far more volatile than stocks, making the crypto index much more dynamic—quickly swinging between extremes.
-
Data Sources: The stock index relies on stock volatility, options (put/call ratios), bond yields, and other traditional data. The crypto index incorporates modern inputs like social media and Google Trends, reflecting a younger, more tech-native investor base.
-
Speed of Reaction: Crypto markets trade 24/7, driving faster sentiment shifts than stock markets, which have fixed hours and weekends.
-
Retail Investor Influence: Crypto has a higher proportion of retail investors, making its sentiment index even more sensitive to social trends and mass psychology.
How to Use the Fear and Greed Index in Trading
Buy When Fearful, Sell When Greedy: Strategy Examples
The Fear and Greed Index lends itself to several actionable trading strategies. Here are detailed approaches with specific examples:
1. Buying During Fear
-
When to Use: The index is in extreme fear (0–24) or fear (25–49), indicating an oversold market and likely undervalued assets.
-
Example Strategy:
- Monitor the index on Alternative.me or CoinMarketCap. If it drops below 24, the market is panicking.
- Open the BTC/USDT chart on your preferred exchange; use a 1-hour or 4-hour timeframe for medium-term analysis.
- Check technical indicators: RSI below 30 (oversold) and a bullish MACD crossover signal a potential reversal.
- Identify a support zone and set a limit buy order at or slightly below this level.
- Set a stop-loss 1–2% below entry to cap losses.
- Set take-profit at the next resistance or when the index returns to 50 (neutral), indicating sentiment recovery.
-
Additional Tips: During periods of extreme fear, consider dollar-cost averaging (DCA) by buying small amounts as prices fall to lower your average entry.
2. Selling During Greed
-
When to Use: The index reads greed (51–74) or extreme greed (75–100), signaling an overbought market and elevated correction risk.
-
Example Strategy:
- Wait for the index to rise above 75—an overheated market signal.
- Open the ETH/USDT (or another asset) chart and check: RSI above 70 (overbought), price at or beyond the upper Bollinger Band.
- If aggressive, short on the futures market with 5x–10x leverage—use caution, as leverage raises liquidation risk.
- Set a stop-loss 1–2% above entry in case of continued upside.
- Set take-profit at the next support or when the index drops to 50, signaling cooling sentiment.
-
Alternative Approach: For long-term spot holdings, extreme greed is a good time to take partial profits—sell 20–30% to lock in gains, while keeping some exposure for further upside.
3. Contrarian Tactics
Contrarian strategy means acting against the crowd: buy when fear is rampant, sell when greed prevails:
- When the index is at 10 (extreme fear), look for long-term spot entries in BTC or ETH. Historically, these have preceded major reversals.
- At 90 (extreme greed), take profits or open short futures positions for a likely correction.
- Analyze historical index data for patterns between extreme readings and subsequent price movements.
4. Combining with Other Tools
The index is most powerful when paired with other technical and fundamental tools:
- RSI: Confirms market oversold (RSI < 30) or overbought (RSI > 70).
- MACD: Flags trend reversals via bullish/bearish crossovers.
- Volume: High volume alongside price moves suggests trend strength; low volume can signal weakness.
- Support/Resistance: Identify key levels to set your entries and exits.
- Fundamental Analysis: Factor in macro trends, regulatory news, protocol upgrades, and other market-moving events.
Practical Tips for Traders
-
Don’t Rely Solely on the Index: It’s a valuable tool, but always combine it with technical and fundamental analysis.
-
Use Demo Accounts: Test strategies in a risk-free environment before trading live to see how the index fits your style and which indicators work best.
-
Review Historical Data: Study past index behavior in different market conditions and its correlation with BTC price moves.
-
Manage Risk: Always set stop-losses. Avoid high leverage (over 10x) in volatile markets to prevent liquidation.
-
Diversify: Don’t put all your capital in one asset. Spread risk across BTC, major altcoins, and stablecoins.
-
Monitor Social Media: Regularly check sentiment on X, Reddit, Telegram, and crypto forums to validate index signals and spot early shifts.
-
Be Patient: Don’t jump in at the first sign of fear or greed. Wait for confirmation from your indicators and ensure your strategy suits current conditions.
-
Keep a Trading Journal: Log every trade, including the index value at entry and exit, to identify patterns and refine your approach.
Conclusion
The Crypto Fear and Greed Index is a powerful tool for gauging market sentiment and making sound trading decisions. It helps traders and investors spot extreme fear or greed—and use these signals to optimize buy and sell opportunities.
To use the index effectively, take a holistic approach: monitor it regularly, pair it with technical and fundamental analysis, manage risk rigorously, and keep learning. Remember, the index is just one tool, best used alongside others for optimal results.
Track the index on reliable platforms like Alternative.me, CoinMarketCap, or CoinStats, test strategies on demo accounts, and practice disciplined capital management. This way, you can turn market emotions into your edge and build long-term success in crypto trading.
FAQ
What is the Cryptocurrency Fear and Greed Index?
The Fear and Greed Index quantifies investor emotions in the crypto market—especially fear and greed. By assigning a numerical value to market sentiment, it helps traders spot trends and price swings. The index ranges from 0 (extreme fear) to 100 (extreme greed), reflecting the psychological mood of the market.
How is the Crypto Fear and Greed Index Calculated? What Factors Are Included?
The index aggregates several weighted factors: volatility (25%), trading volume and market dynamics (25%), social media sentiment (15%), Bitcoin dominance (10%), and Google Trends (10%). Each is weighted toward a final score from 0 (extreme fear) to 100 (extreme greed).
Where Can I View the Crypto Fear and Greed Index Online?
You can check the Crypto Fear and Greed Index on CoinMarketCap. Visit https://coinmarketcap.com/charts/fear-and-greed-index/ for real-time sentiment data.
How Can I Build an Investment Strategy Using the Fear and Greed Index?
The index indicates market sentiment. Low readings (0-20) signal fear and buying opportunities, while high scores (80-100) warn of market overheating. Combine the index with technical and fundamental analysis to make optimal decisions.
How Reliable Is the Fear and Greed Index for Predicting Crypto Prices?
The index reflects market mood, not future price direction. It’s most effective when paired with technical analysis and other indicators. In crypto’s volatile environment, treat it as a supplemental tool—not a sole predictor.
What Does a Low Fear Index Mean? What Does a High Greed Index Mean?
A low fear index suggests the market may be bottoming, presenting buying opportunities. A high greed index implies the market could be at a local top and ripe for a correction.
How Does the Fear and Greed Index Relate to Bitcoin Price Movements?
The index generally moves inversely with Bitcoin price. When the index is high (extreme greed), prices tend to rise; when it’s low (extreme fear), prices often fall. The index reflects investor emotions and frequently leads market moves.
Advanced Strategies for Crypto Algorithmic Trading
Bitcoin Stock-to-Flow Ratio: Comprehensive Analysis and Insights
Cryptocurrency Market Sentiment Index

Mastering Whale Strategies in Cryptocurrency Trading

How to Interpret Technical Indicators for Crypto Trading Success?

How Do Technical Indicators Signal Crypto Market Trends in 2025?

Creating and Managing Your Multi-Chain Web3 Wallet

Automated Market Makers (AMM)

NFT 無聊猿是什麼?5 分鐘輕鬆看懂無聊猿的起源和生態!

What is BlockDAG: Better Network Scalability with Directed Acyclic Graph

Understanding Decentralized Exchanges
