LCP_hide_placeholder
fomox
MarketsPerpsSpotSwapMeme Referral
More
Smart Money Recruitment
Search Token/Wallet
/

Crypto Fear & Greed Index Rises to 19, Still in Extreme Fear Territory

2026-01-17 01:16:48
Bitcoin
Crypto Insights
Crypto Trading
Investing In Crypto
Macro Trends
Article Rating : 4.5
half-star
38 ratings
This comprehensive guide explains the Crypto Fear & Greed Index, a sentiment indicator measuring investor emotions on a scale of 0-100, where extreme fear signals potential buying opportunities and excessive greed warns of corrections. The article examines the index's current reading of 19, indicating persistent extreme fear through analysis of multiple metrics: market volatility, trading volume, social media sentiment, Bitcoin dominance, and Google Trends data. Historical evidence demonstrates that extreme fear readings often precede significant market recoveries, providing contrarian investors strategic entry points. However, the index serves as one tool within a broader investment strategy rather than a standalone timing signal. The guide covers key factors influencing sentiment calculations and provides practical trading frameworks for both beginners and experienced investors navigating fear-driven market conditions on platforms like Gate.
Crypto Fear & Greed Index Rises to 19, Still in Extreme Fear Territory

What Is the Crypto Fear & Greed Index

The Crypto Fear & Greed Index is a comprehensive sentiment indicator designed to measure the emotional state of cryptocurrency investors on a scale from 0 to 100. This analytical tool synthesizes multiple data sources to provide a holistic view of market psychology. A reading of 0 represents "extreme fear," while 100 indicates "extreme greed." The index serves as a valuable barometer for understanding whether market participants are overly pessimistic or excessively optimistic at any given moment.

The methodology behind the Crypto Fear & Greed Index incorporates several key metrics, including market volatility patterns, trading volume fluctuations, social media sentiment analysis, Bitcoin dominance ratios, and Google Trends search data. By combining these diverse data points, the index offers investors a nuanced understanding of prevailing market conditions that goes beyond simple price movements.

Current Index Reading and Market Implications

According to recent data from BitcoinWorld, the Crypto Fear & Greed Index has experienced an upward movement, climbing six points to reach a reading of 19. Despite this increase, the index remains firmly anchored in "extreme fear" territory, suggesting that investor caution continues to dominate market sentiment. This level of fear typically emerges during periods of significant market uncertainty or following substantial price corrections.

A reading of 19 indicates that market participants are exhibiting deep hesitation and risk aversion. Such extreme fear levels often coincide with market bottoms or major correction phases, when negative sentiment reaches its peak. Investors in this environment tend to sell assets out of panic or avoid entering positions altogether, creating potential opportunities for those with longer-term investment horizons and higher risk tolerance.

Historical Context and Investment Opportunities

Historical analysis of the Crypto Fear & Greed Index reveals that extreme fear readings have frequently preceded significant market recoveries. When the index drops below 20, it has often marked inflection points where contrarian investors found attractive entry opportunities. Patient investors who accumulated positions during previous extreme fear periods have sometimes been rewarded as markets eventually stabilized and recovered.

However, it is important to note that extreme fear readings do not guarantee immediate price reversals. Markets can remain in fearful states for extended periods, and prices may continue declining even as sentiment reaches extreme lows. The index should be viewed as one component of a comprehensive investment strategy rather than a standalone timing signal. Successful navigation of extreme fear environments typically requires thorough fundamental analysis, proper risk management, and a disciplined approach to position sizing.

Factors Influencing the Index

The Crypto Fear & Greed Index derives its readings from multiple contributing factors that collectively paint a picture of market sentiment. Market volatility plays a crucial role, with heightened price swings typically pushing the index toward fear territory. When cryptocurrencies experience sharp price movements in short timeframes, investor anxiety naturally increases, reflected in lower index readings.

Trading volume represents another significant component, as unusual volume patterns can indicate panic selling or enthusiastic buying. Social media mentions and sentiment analysis provide real-time insights into how the broader community is discussing and reacting to market developments. Additionally, factors such as Bitcoin dominance—the percentage of total cryptocurrency market capitalization held by Bitcoin—offer clues about risk appetite, as investors often flee to Bitcoin during uncertain times.

Google Trends data tracking search interest in cryptocurrency-related terms also contributes to the index calculation. Increased searches for terms like "Bitcoin crash" or "crypto sell" typically correlate with higher fear levels, while searches for "buy Bitcoin" or "crypto investment" suggest growing greed. This multi-faceted approach ensures the Crypto Fear & Greed Index captures a comprehensive view of market psychology across various dimensions.

FAQ

What is the Crypto Fear & Greed Index and how is it calculated?

The Crypto Fear & Greed Index measures investor sentiment on a scale of 0 to 100. It calculates based on market volatility (25%), price momentum and trading volume (25%), Bitcoin dominance (10%), and social media activity (15%), plus survey data and market cap.

What does Fear & Greed Index at 19 mean? Why is it in extreme fear territory?

Index at 19 indicates extreme market pessimism with panic selling pressure. This score falls in the extreme fear zone (0-25), typically presenting a potential low entry point for long-term investors seeking opportunities.

When the cryptocurrency market Fear & Greed Index is low, how should you invest?

When the fear index drops, consider accumulating quality assets through dollar-cost averaging. Extreme fear often signals oversold conditions, presenting strategic entry points for long-term investors. History shows market sentiment typically rebounds after extreme panic phases.

What is the lowest value the Fear & Greed Index has reached in history?

The Fear & Greed Index reached its lowest historical value of 8, occurring during a period of extreme market pessimism when participants were gripped by widespread fear and panic.

What is the relationship between Fear & Greed Index and Bitcoin price movement?

The Fear & Greed Index measures market sentiment and predicts Bitcoin price direction. Low scores indicate extreme fear, historically preceding price rebounds and buying opportunities. High scores suggest extreme greed, often preceding corrections and selling opportunities. Market sentiment drives price action.

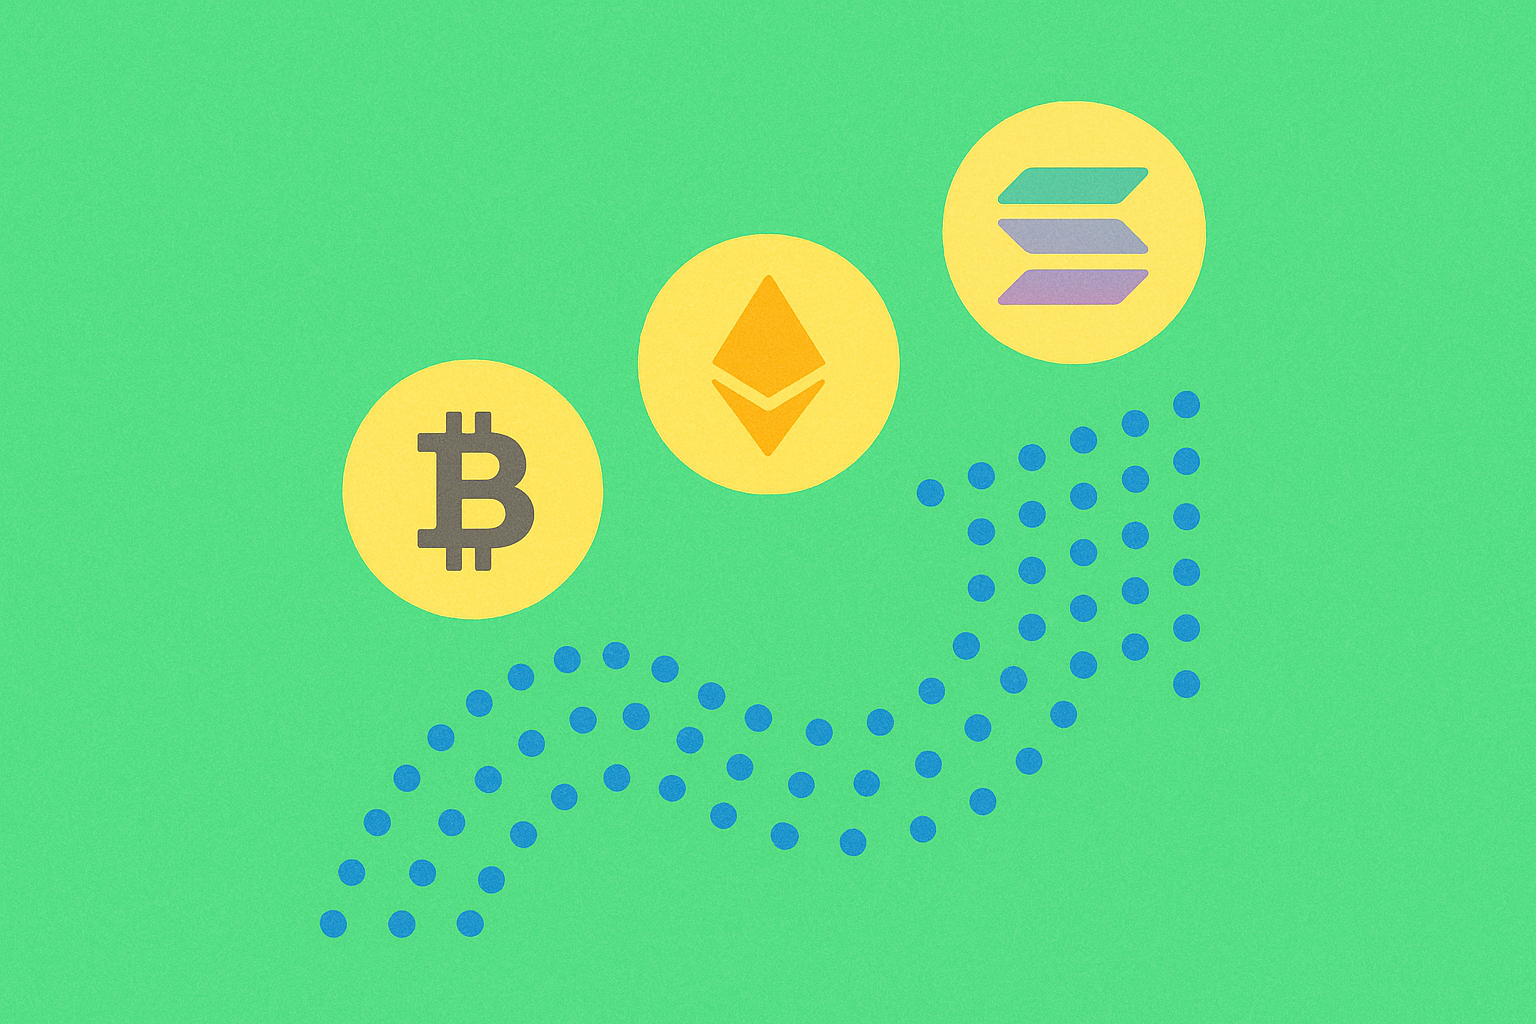
In extreme fear market environments, which crypto assets deserve more attention?

Focus on Bitcoin and Ethereum for stability and proven resilience. Stablecoins provide safe havens. Extreme fear historically precedes market recoveries, creating opportunities for long-term investors through dollar-cost averaging strategies.

How to use Fear & Greed Index for trading decisions?

Use the index to identify market extremes. When fear reaches 0-24, consider buying opportunities as assets may be undervalued. When greed hits 75-100, be cautious as reversals often follow. Don't rely solely on this tool; combine it with technical analysis and market fundamentals for optimal trading strategy.

* The information is not intended to be and does not constitute financial advice or any other recommendation of any sort offered or endorsed by Gate.

Share

Content

What Is the Crypto Fear & Greed Index

Current Index Reading and Market Implications

Historical Context and Investment Opportunities

Factors Influencing the Index

FAQ

Related Articles
Crypto Winter: Predicting the Recovery Path Forward

Crypto Winter: Predicting the Recovery Path Forward

The article explores the concept of "crypto winter," a prolonged downturn in cryptocurrency markets characterized by depressed prices and reduced trading activity. It offers insights into the causes, features, and duration of these challenging periods, as well as strategies for surviving and thriving, such as dollar-cost averaging and technical analysis. Ideal for traders and investors navigating market cycles, the piece outlines the importance of understanding market dynamics and maintaining a focus on blockchain innovation. By providing survival tips, it equips readers to approach crypto winter strategically and seize long-term opportunities.
2025-12-20 12:19:42
Understanding Bullish Trends in Cryptocurrency Markets

Understanding Bullish Trends in Cryptocurrency Markets

The article provides a comprehensive guide to understanding bullish trends in the cryptocurrency market, particularly focusing on Bitcoin. It explains key characteristics, driving factors, and strategies for identifying and engaging with bullish conditions. Readers will learn about market sentiment, historical cycles, and risk management, making it essential for investors and enthusiasts aiming for informed decision-making. Featuring detailed sections on supply-demand dynamics, adoption, and psychological aspects, the article is well-structured for quick understanding. Keywords like 'bullish Bitcoin,' 'market conditions,' and 'trading strategies' enhance readability and scanning efficiency.
2025-12-20 17:47:25
What Is Crypto Exchange Net Inflow and Why Does It Matter for Trading Strategy?

What Is Crypto Exchange Net Inflow and Why Does It Matter for Trading Strategy?

# Article Introduction **Understanding Crypto Exchange Net Inflow and Its Impact on Trading Strategy** This comprehensive guide reveals how exchange net inflow serves as a critical indicator for identifying market sentiment and predicting price movements. By analyzing capital flow patterns on Gate and monitoring whale accumulation concentration, traders gain actionable insights into institutional positioning and market direction. The article examines three core mechanisms: exchange net inflow dynamics that signal buying or selling pressure, holding concentration patterns that indicate whale positioning, and on-chain lock-up rates that predict medium-term opportunities. Designed for active traders and crypto investors, this resource demonstrates how to interpret net inflow data alongside price action to optimize entry and exit strategies. Master these metrics to anticipate trend reversals before retail traders recognize market shifts.
2025-12-28 02:21:36
What Is the Crypto Market Fear and Greed Index?

What Is the Crypto Market Fear and Greed Index?

Explore how the Fear and Greed Index operates in the crypto market. Understand how to read sentiment signals, spot buy and sell opportunities in Bitcoin, and leverage this vital tool to refine your trading strategies using psychological indicators.
2026-01-02 12:18:43
Understanding Bull and Bear Markets in Cryptocurrency

Understanding Bull and Bear Markets in Cryptocurrency

Explore comprehensive analysis of cryptocurrency bull markets, including clear definitions, key characteristics, and distinctions between bull and bear markets. This article thoroughly examines Bitcoin bull market cycles and investment strategies, equipping you with actionable techniques to capitalize on opportunities at Gate Exchange. Learn how to spot bull market signals and apply effective risk management strategies.
2026-01-08 11:15:46
Understanding Bull and Bear Markets in Cryptocurrency

Understanding Bull and Bear Markets in Cryptocurrency

Explore the bull market—a period marked by increasing cryptocurrency prices—through an in-depth review of key characteristics, effective trading strategies, and practical ways to spot bullish market conditions, designed for beginner and intermediate investors on Gate.
2026-01-08 20:16:38
Recommended for You
What is The White Whale (WHITEWHALE) price and market cap today?

What is The White Whale (WHITEWHALE) price and market cap today?

White Whale (WHITEWHALE) is a Solana-based meme coin currently trading at $0.088148 with a 13.21% gain in the last 24 hours and a market capitalization of approximately $88.75 million. The token demonstrates strong market activity with $77.82 million in daily trading volume across 57 active market pairs, indicating robust liquidity and investor participation within the Solana ecosystem. WHITEWHALE maintains a near-complete circulating supply of 999.82 million tokens out of its total one billion supply, eliminating inflation concerns while concentrating value on demand dynamics. The token trades on major exchanges including Gate, Bybit, and MEXC, providing global accessibility for retail traders, though institutional-scale trading may face shallow order book challenges. Market metrics reveal WHITEWHALE operates as a mid-tier cryptocurrency asset ranked around #330, with an all-time high of $0.1997 reached in January 2026. This comprehensive overview provides essential price, valuation, and liquidity informatio
2026-01-17 03:00:27
What is YB Yield Basis crypto market overview: $39.74M market cap ranking and 24H trading volume

What is YB Yield Basis crypto market overview: $39.74M market cap ranking and 24H trading volume

YieldBasis (YB) holds a $39.74M market cap ranking #514 in the cryptocurrency market, demonstrating moderate market participation with $6.49M in 24-hour trading volume. This DeFi protocol distinguishes itself by combining leveraged liquidity mechanisms with Curve's crvUSD stablecoin to generate enhanced yields while mitigating impermanent loss for Bitcoin and Ethereum holders. With 87.92M circulating tokens trading between $0.4181-$0.4574, YB maintains balanced market dynamics across 31 exchange platforms including Gate, MEXC, CoinDesk, and Capital.com. The multi-exchange accessibility enhances price discovery and removes trading barriers for diverse investors. YB's moderate liquidity and consistent trading activity reflect genuine investor interest in its innovative yield-farming utility, establishing it as a noteworthy consideration for DeFi-focused portfolios seeking practical applications beyond speculative value.
2026-01-17 02:56:02
What are the smart contract vulnerabilities and security risks in YieldBasis (YB) DeFi protocol?

What are the smart contract vulnerabilities and security risks in YieldBasis (YB) DeFi protocol?

This comprehensive security analysis examines YieldBasis (YB) DeFi protocol's vulnerability landscape across multiple dimensions. The article identifies critical smart contract risks within YieldBasis's layered vault architecture, strategy execution, and leverage mechanisms that create exploitation vectors. Drawing from 2025's $2.94 billion DeFi losses and documented incidents like the Truebit protocol breach, the analysis reveals smart contract vulnerabilities represent 30.5% of cryptocurrency exploits. Beyond code-level risks, the article addresses centralized custody threats to YB's $39.2M market cap when users trade on Gate, alongside regulatory compliance gaps in KYC/AML implementation. The integrated assessment provides users practical safeguards including multi-signature wallets, security audits review, and phased capital deployment strategies for mitigating YieldBasis protocol risks.
2026-01-17 02:54:03
How does Federal Reserve monetary policy impact Bitcoin price in 2026: inflation data and stock market correlation analysis

How does Federal Reserve monetary policy impact Bitcoin price in 2026: inflation data and stock market correlation analysis

This comprehensive analysis examines how Federal Reserve monetary policy shapes Bitcoin valuations in 2026 through three interconnected mechanisms. First, core PCE inflation data at 2.4% influences interest rate expectations, creating Bitcoin price volatility as investors reassess opportunity costs between risk-free yields and cryptocurrencies. Second, Bitcoin's correlation with the S&P 500 has collapsed from 68% to 31%, reflecting institutional adoption treating Bitcoin as a core diversification asset rather than speculative equity proxy. Third, divergent ETF flows reveal sophisticated capital reallocation: $243 million Bitcoin outflows versus $168-174 million Ethereum inflows signal institutional discrimination based on macroeconomic conditions and regulatory clarity. BlackRock's IBIT dominance further accelerates adoption through regulated mega-cap managers. Understanding these monetary policy transmission channels, correlation shifts, and institutional positioning provides Bitcoin investors critical frame
2026-01-17 02:51:28
What is the current crypto market overview and which coins have the highest market cap in 2026?

What is the current crypto market overview and which coins have the highest market cap in 2026?

This comprehensive overview examines the 2026 cryptocurrency market landscape, highlighting Bitcoin and Ethereum's combined $2 trillion market capitalization dominance. The article analyzes how institutional adoption—evidenced by 14% surge in institutional users and $130 billion capital inflows—has transformed digital assets into mainstream investment vehicles. Key topics include regulatory clarity driving institutional participation across major exchanges like Gate, the concentrated 40% Bitcoin market depth reflecting institutional liquidity patterns, and daily trading volumes demonstrating improved market efficiency. The guide explores top 10 cryptocurrency circulation rates, tier-1 trading pair dynamics, and how stablecoin integration supports infrastructure development. Through detailed trading volume analysis and FAQ insights, readers gain actionable understanding of 2026's mature crypto market structure, emerging coin opportunities, and critical risk factors shaping institutional investment strategies i
2026-01-17 02:49:29
What is the fundamental analysis of cryptocurrency projects: whitepaper logic, use cases, and team background explained

What is the fundamental analysis of cryptocurrency projects: whitepaper logic, use cases, and team background explained

This comprehensive guide explores fundamental analysis of cryptocurrency projects through five critical dimensions. It examines whitepaper core logic including tokenomics architecture, value proposition, and problem-solution alignment that establish project foundations. The article evaluates real-world use cases by analyzing market demand, adoption potential, and measurable transaction metrics that demonstrate genuine utility. Technical innovation assessment covers blockchain architecture, security features, and scalability metrics essential for institutional-grade infrastructure. Roadmap execution analysis reveals management competence through milestone achievement and transparent timeline assessment. Finally, team credentials evaluation prioritizes founder background, technical expertise, and verifiable track records. Combined with practical FAQ guidance, this framework enables investors to distinguish viable projects from speculation-driven assets through data-driven fundamental analysis.
2026-01-17 02:47:14