How to Read Crypto Derivatives Market Signals: Futures Open Interest, Funding Rates, and Liquidation Data Explained

Understanding Futures Open Interest and Its Impact on Price Momentum
Futures open interest represents the total number of active contracts that haven't been settled or closed in the derivatives market. This metric provides crucial insight into market positioning and helps traders gauge whether an uptrend or downtrend has strong conviction behind it. When futures open interest increases alongside rising prices, it typically signals strengthening price momentum, as new capital continues entering long positions. Conversely, declining open interest during price rallies suggests momentum weakening, often preceding pullbacks as traders close positions.
The relationship between open interest and price momentum operates as a validity check for market moves. A substantial price increase paired with rising futures open interest indicates bullish conviction from market participants, reflecting genuine buying pressure rather than a temporary squeeze. This alignment between price action and open interest expansion often sustains market trends for longer periods. Traders monitoring this correlation can identify whether rallies are supported by accumulating leverage or merely technical bounces on limited participation.
Fluctuations in open interest also reveal when major support or resistance levels are being tested. Rising open interest near key price levels indicates traders are building positions with conviction, making breakouts more likely to sustain. Understanding this derivatives market signal enables traders to differentiate between genuine trend reversals and false signals, improving decision-making in volatile crypto markets.
Decoding Funding Rates and Long-Short Ratio to Identify Market Sentiment Extremes
Funding rates represent the periodic payments traders exchange when opening leveraged positions in perpetual futures markets. When funding rates turn significantly positive, it signals excessive bullish sentiment—traders are paying premium rates to hold long positions. Conversely, deeply negative funding rates indicate bearish extremes where shorts dominate. These rates serve as a sentiment barometer precisely because they reflect actual capital allocation decisions rather than speculation.
The long-short ratio complements funding rate analysis by displaying the proportion of long versus short positions at any given moment. When this ratio reaches extreme highs, it reveals that an unusually large percentage of traders have positioned themselves bullishly, often preceding corrections. Extreme lows suggest the opposite scenario. Sophisticated traders monitor both metrics simultaneously on platforms like gate to identify when market sentiment reaches inflection points.
Market sentiment extremes occur when these indicators converge with persistent, elevated readings. High funding rates paired with elevated long-short ratios create conditions where the market becomes vulnerable to liquidations, as overleveraged positions unwind explosively. Professional traders use these sentiment signals to anticipate reversals, positioning contrary to crowded trades. Understanding this dynamic transforms funding rates and long-short ratios from mere statistical observations into actionable market intelligence for timing entries and exits effectively.
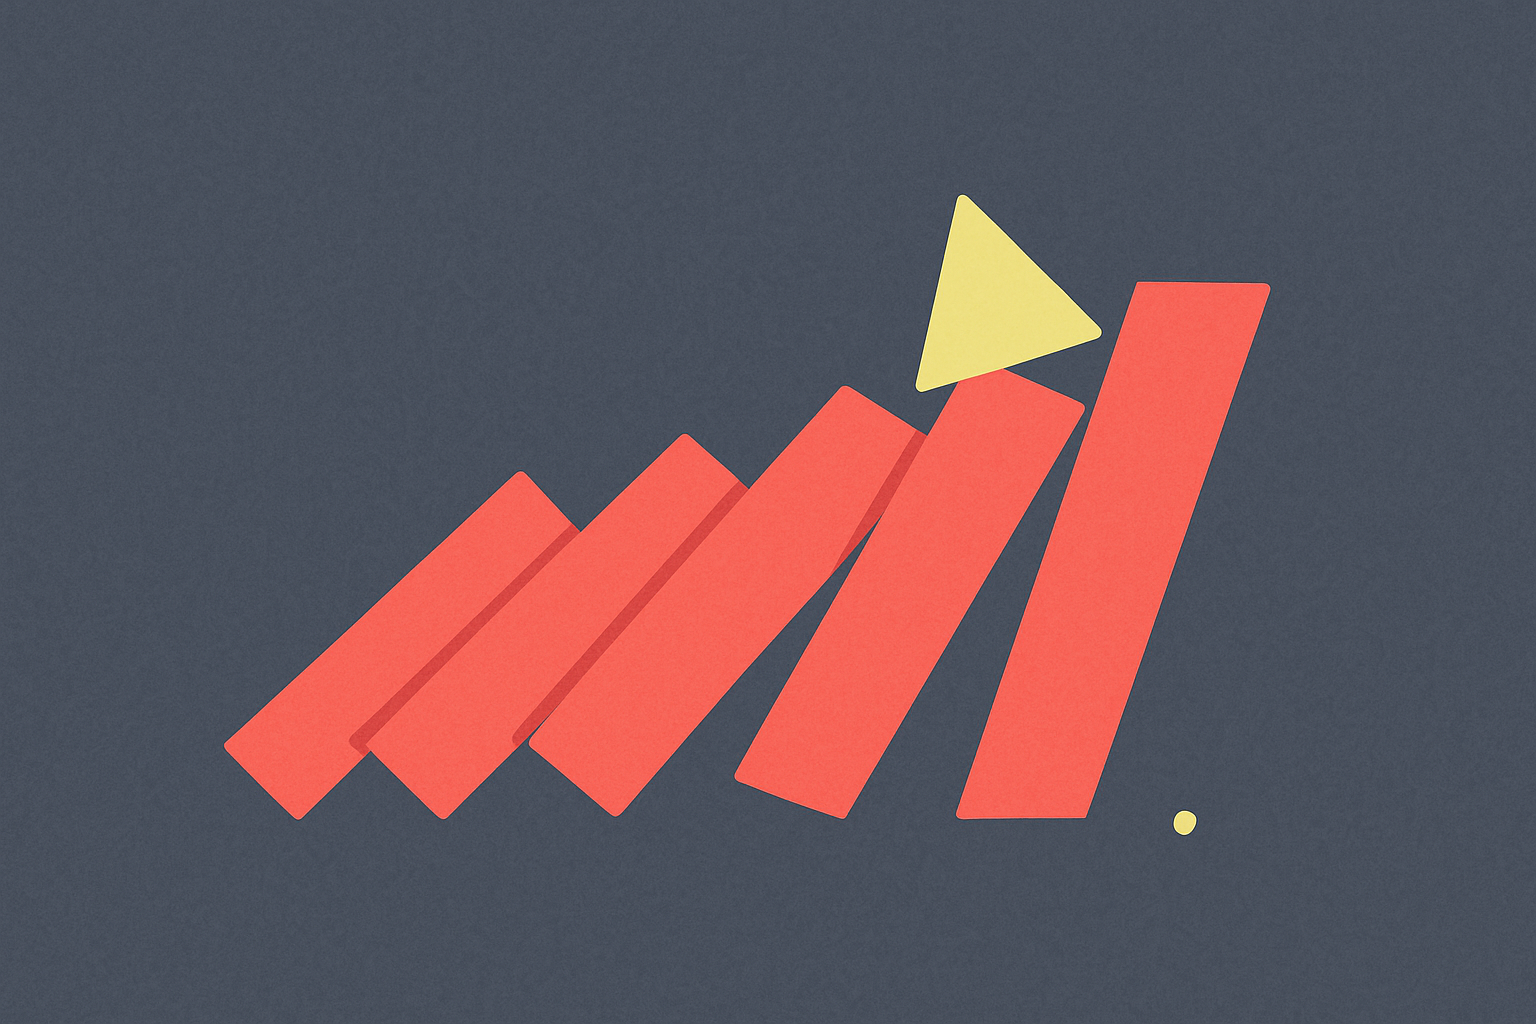
Analyzing Options Open Interest and Liquidation Cascades as Risk Indicators
Options open interest serves as a critical barometer for gauging market sentiment and identifying potential stress points in the derivatives ecosystem. When open interest reaches elevated levels, it signals substantial capital deployment in options contracts, creating a scenario where large price moves can trigger cascading liquidations across multiple positions simultaneously. This phenomenon, known as liquidation cascades, represents one of the most significant risk indicators traders monitor.
The mechanics are straightforward: as open interest accumulates in options contracts, the underlying notional value grows exponentially. When price movements breach key strike levels, stop-losses execute in rapid succession, forcing liquidations that accelerate price momentum in both directions. Historical market data demonstrates that periods of extreme options open interest frequently precede volatile market reversals and sharp corrections. For instance, concentrated call or put positioning can amplify intraday swings by 20-30% beyond what would occur under normal trading conditions.
Liquidation cascades become particularly dangerous when options open interest converges with elevated leverage in futures markets. Traders analyzing derivatives signals must cross-reference options data with futures liquidation levels to identify confluence zones where systemic risk peaks. When multiple liquidation layers align near specific price levels, even modest directional moves can trigger exponential unwinds. Monitoring these risk indicators holistically enables traders to anticipate market dislocations before they materialize, providing crucial protective advantages.
FAQ
How to read funding rate crypto?
Funding rates show the cost of holding leverage positions between traders. Positive rates mean longs pay shorts, indicating bullish sentiment. Negative rates mean shorts pay longs, showing bearish pressure. Extreme rates signal potential reversals, helping traders gauge market direction and positioning.
How to understand open interest in crypto?
Open interest represents the total number of active crypto futures contracts outstanding at any time. It indicates market sentiment and liquidity. Rising open interest suggests increased trader participation and potential trend continuation, while declining open interest may signal weakening momentum or trend reversal.
How to read the crypto market?
Monitor key derivatives signals: futures open interest indicates market positioning strength, funding rates reveal sentiment extremes, and liquidation data shows support and resistance levels. High open interest with rising prices signals bullish conviction. Positive funding rates suggest leveraged longs; negative rates indicate shorts domination. Large liquidations often mark potential reversals.
How do you get liquidated in crypto futures?
Liquidation occurs when your position's losses exceed your margin deposit. As the asset price moves against your trade, the exchange automatically closes your position to prevent further losses. Your remaining margin is forfeited to cover the deficit.
What is the relationship between funding rates, open interest, and liquidation cascades?
Funding rates incentivize position balancing in leveraged markets. High open interest with elevated funding rates increases liquidation risk. When prices move sharply, cascading liquidations trigger margin calls, forcing position closures that amplify price momentum and market volatility.
How to use liquidation data to predict market trends and identify support/resistance levels?
Monitor liquidation cascades at key price levels to identify potential support and resistance zones. High liquidation volumes signal strong price rejection, helping traders spot reversal points and predict trend continuations or breakouts.
FAQ
What is strax crypto?
STRAX is a blockchain platform token designed for decentralized applications and smart contracts. It offers fast transaction speeds, low fees, and enhanced security features. STRAX enables users to participate in network validation and earn rewards through staking mechanisms.
What is the future of the Strax coin?
Strax coin is positioned for significant growth through continuous blockchain innovation, expanded ecosystem adoption, and increasing institutional interest. With strong development roadmap, enhanced scalability solutions, and strategic partnerships, Strax is expected to strengthen its market position and deliver substantial long-term value.
How do I buy and store STRAX coins?
Purchase STRAX through major crypto platforms, then transfer to a secure wallet. Hardware wallets offer maximum security, while software wallets provide convenient access. Choose based on your holding duration and security preferences.
What technology and blockchain does STRAX use?
STRAX operates on its own independent blockchain built with advanced smart contract capabilities. It utilizes Proof of Stake consensus mechanism and supports decentralized applications with high throughput and low transaction costs.
What are the risks and security considerations for STRAX?
STRAX implements multi-layer security protocols including smart contract audits, cold storage infrastructure, and blockchain validation mechanisms. Main considerations include market volatility, liquidity variations, and standard cryptocurrency operational risks. Users should maintain strong wallet security practices and verify official channels.

What Are Derivatives Market Signals: Futures Open Interest, Funding Rates, Long-Short Ratio, and Liquidation Data Explained
How do derivatives market signals predict crypto price manipulation and liquidation cascades?

What Do Crypto Derivatives Market Signals Reveal: Futures Open Interest, Funding Rates, and Liquidation Data Explained
What Are Crypto Derivatives Market Signals: Understanding Futures Open Interest, Funding Rates, and Liquidation Data

How Do Crypto Derivatives Market Signals Like Funding Rates, Open Interest, and Liquidation Data Impact Your Trading Strategy?
What Do Crypto Derivatives Market Signals Tell You About Future Price Movements?

What are the compliance and regulatory risks in cryptocurrency markets and how do SEC regulations impact digital assets?

Catch the Wave: Top 6 TGE Tokens to Watch in the Near Future
What is project fundamentals analysis and why does it matter for crypto investors in 2026
What Causes Crypto Price Volatility and How Do Support and Resistance Levels Impact Trading

OGCommunity Premarket Guide: $OGC Early Access to Trading and Key Listing Info