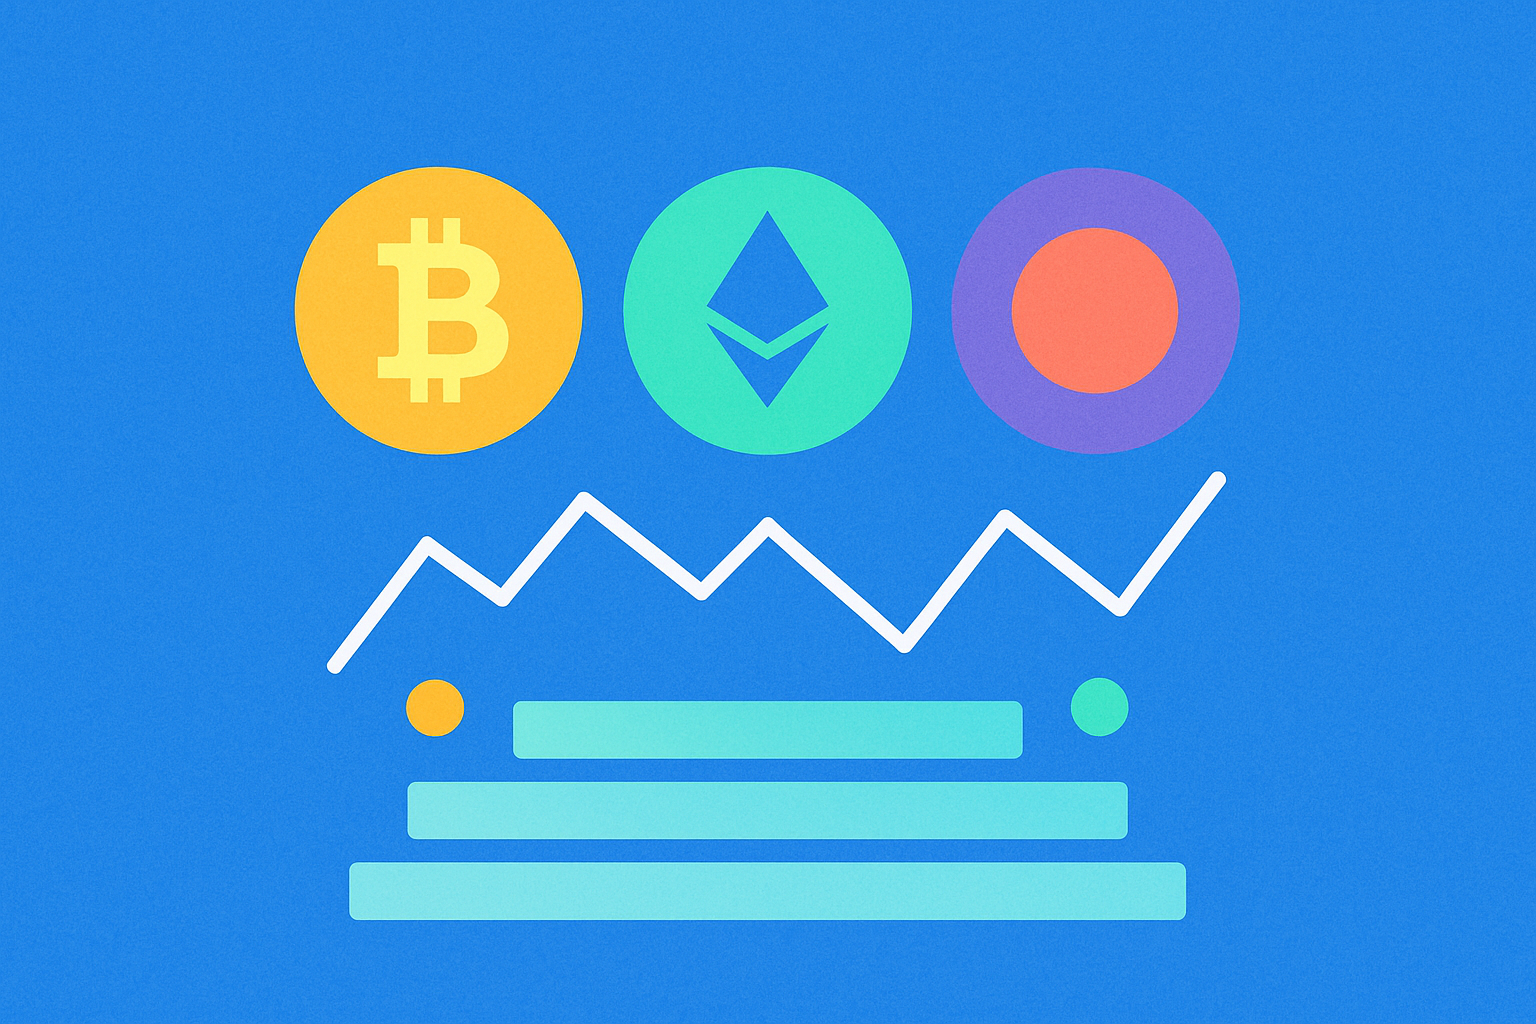
What Are Crypto Derivatives Market Signals: Understanding Futures Open Interest, Funding Rates, and Liquidation Data

Futures Open Interest and Funding Rates: Key Indicators of Market Sentiment and Leverage Positioning
Futures open interest and funding rates serve as powerful barometers for understanding trader behavior and market dynamics within the derivatives market. These metrics provide crucial insight into how much leverage participants are utilizing and whether market sentiment is predominantly bullish or bearish.
Open interest represents the total number of outstanding futures contracts that haven't been settled or closed. Rising open interest during price increases typically signals strengthening bullish sentiment, as traders initiate new long positions. Conversely, declining open interest during price rallies may indicate that existing positions are being liquidated rather than new ones being opened, suggesting potential weakness beneath the surface. This metric directly reflects the aggregate leverage positioning across the market, making it essential for identifying potential liquidation cascades.
Funding rates operate as a mechanism balancing the derivatives market. When perpetual futures prices diverge from spot prices, funding payments flow between long and short position holders to realign incentives. Elevated positive funding rates indicate that long positions are paying shorts—a sign of strong bullish sentiment and high leverage accumulation. Negative funding rates suggest the opposite, with bearish positioning dominating. Extreme funding rates historically precede market reversals, as unsustainably high leverage often triggers forced liquidations.
Together, these indicators reveal the underlying market sentiment and positioning concentration. By monitoring shifts in futures open interest alongside funding rate trends, traders gain deeper understanding of whether current price movements reflect genuine conviction or overleveraged speculation vulnerable to sudden reversals.
Long-Short Ratio and Options Open Interest: Measuring Trader Positioning and Hedging Strategies
The long-short ratio represents a fundamental derivatives market signal that quantifies the balance between bullish and bearish trader positioning. This metric tracks the volume of long positions relative to short positions in futures and perpetual contracts, revealing whether traders are predominantly betting on price increases or decreases. When this ratio rises significantly, it indicates excessive bullish sentiment, which often precedes corrections—conversely, extreme short positioning can signal potential rebounds. On derivatives trading platforms like gate, monitoring this ratio provides crucial insights into overall market sentiment dynamics.
Options open interest complements the long-short ratio by offering additional layers of market signal interpretation. This metric reflects the total volume of outstanding option contracts and reveals where traders are hedging their exposures or speculating on future price movements. High call open interest suggests bullish expectations, while elevated put open interest indicates defensive positioning or bearish sentiment. The beauty of tracking options open interest lies in its ability to expose hidden trader positioning that might not be immediately apparent from spot market activity alone.
Together, these derivatives signals enable traders to construct comprehensive hedging strategies aligned with overall market conditions. By analyzing the long-short ratio alongside options open interest data, market participants can identify whether current positioning represents genuine conviction or crowded trades vulnerable to liquidations. This combination helps sophisticated traders time entries and exits more effectively while understanding the risk landscape shaped by collective trader positioning and sentiment. These metrics essentially translate complex derivatives activity into actionable market intelligence for risk management and strategic planning.
Liquidation Data and Risk Metrics: Identifying Market Turning Points Through Forced Position Closures
Liquidation data provides crucial insights into market vulnerability by tracking positions forced to close when prices move against traders' collateral ratios. These forced position closures represent a distinct category of market signal that often congregates at critical price levels, creating cascading selloffs or buybacks depending on the liquidation direction. When liquidation data reveals concentrated clusters at specific price points, these become predictable turning points where market momentum typically accelerates or reverses.
The relationship between liquidation cascades and market extremes demonstrates how risk metrics function as quantifiable turning point indicators. High liquidation volume at support or resistance levels suggests traders are operating with maximum leverage, signaling potential capitulation zones. For instance, during rapid price movements—such as those observed in volatile assets—liquidation data accumulates at psychological price levels, where traders' stop losses trigger simultaneously, amplifying directional moves.
Risk metrics derived from liquidation data help identify when markets approach exhaustion points. By monitoring liquidation density across different leverage levels, traders can gauge market psychology and positioning extremity. When liquidation data shows concentrated forced closures at recent highs or lows, it typically indicates either capitulation or euphoria, both precursors to reversal patterns. This metric-driven approach to analyzing market signals enables more precise risk management and strategic position timing based on actual liquidation mechanics rather than speculation.
FAQ
What are derivatives in crypto?
Crypto derivatives are financial contracts whose value derives from underlying cryptocurrencies. They include futures, options, and perpetual contracts, allowing traders to speculate on price movements, hedge positions, and amplify returns through leverage without owning the actual assets.
What are the 4 types of derivatives market?
The four main types of crypto derivatives markets are: futures (standardized contracts with expiration dates), options (right to buy or sell at fixed prices), perpetual swaps (unlimited duration contracts), and forwards (customized agreements between parties).
How to understand open interest in crypto?
Open interest represents the total number of outstanding futures contracts that haven't been closed or settled. It indicates market participation level and potential price volatility. Higher open interest suggests stronger market commitment and potential significant price movements when positions liquidate.
What are liquidations in crypto?
Liquidations occur when a trader's collateral falls below the minimum requirement due to unfavorable price movements. The platform automatically closes positions to recover losses, resulting in asset forced sale at market price. This is a critical risk in leveraged trading.
What are funding rates in crypto futures and how do they work?
Funding rates are periodic payments between long and short traders in perpetual futures contracts. When the funding rate is positive, longs pay shorts, incentivizing shorts to enter. Negative rates reward longs. These rates help keep contract prices aligned with spot market prices through market mechanisms.
FAQ
Is ICP coin a good buy?
ICP offers strong fundamentals as the Internet Computer Protocol, enabling decentralized cloud computing. With growing ecosystem adoption and technological innovation, ICP presents compelling long-term value. Consider your investment horizon and portfolio strategy before deciding.
Can ICP reach $100?
Yes, ICP can potentially reach $100. With strong fundamentals, growing ecosystem adoption, and increasing enterprise use cases, ICP has significant upside potential. As the Internet Computer protocol expands its capabilities and user base, a $100 price target is achievable within the medium to long term.
Can ICP reach $1000 dollars?
ICP has significant potential for growth. With continuous development, ecosystem expansion, and increasing adoption of Internet Computer's infrastructure, reaching $1000 is theoretically possible in the long term. However, this depends on market conditions, technological progress, and overall crypto market dynamics.
Is ICP a dead project?
No. ICP remains active with continuous development, ecosystem growth, and strong community engagement. The Internet Computer continues expanding its capabilities and attracting developer interest in the blockchain space.
What is ICP coin and what does Internet Computer do?
ICP is the native token of Internet Computer, a decentralized blockchain that enables building web3 applications and services. Internet Computer provides a platform where developers can create and host smart contracts, dApps, and websites directly on-chain with high speed and low cost.
How do I buy and store ICP tokens?
Purchase ICP tokens through crypto platforms using fiat or other cryptocurrencies. Store them securely in hardware wallets like Ledger or Trezor, or use official ICP wallets for optimal security and control.
What are the main risks and advantages of investing in ICP?
Advantages: ICP powers the Internet Computer, enabling decentralized web services and smart contracts with lower costs. Strong technical foundation and growing ecosystem adoption. Risks: Market volatility, regulatory uncertainty, and competition from other blockchain platforms. Requires careful consideration of your risk tolerance before investing.

What Are Derivatives Market Signals: Futures Open Interest, Funding Rates, Long-Short Ratio, and Liquidation Data Explained

How do derivatives market signals predict crypto price manipulation and liquidation cascades?

How to Read Crypto Derivatives Market Signals: Futures Open Interest, Funding Rates, and Liquidation Data Explained

What Do Crypto Derivatives Market Signals Reveal: Futures Open Interest, Funding Rates, and Liquidation Data Explained

How Do Crypto Derivatives Market Signals Like Funding Rates, Open Interest, and Liquidation Data Impact Your Trading Strategy?
What Do Crypto Derivatives Market Signals Tell You About Future Price Movements?

What is crypto holding and fund flow: exchange inflows, concentration, staking rates, and on-chain lock volume explained
Best Snake Tokens and Memecoins Picks for the Year of the Snake

What are the compliance and regulatory risks in cryptocurrency markets and how do SEC regulations impact digital assets?

Catch the Wave: Top 6 TGE Tokens to Watch in the Near Future

What is project fundamentals analysis and why does it matter for crypto investors in 2026