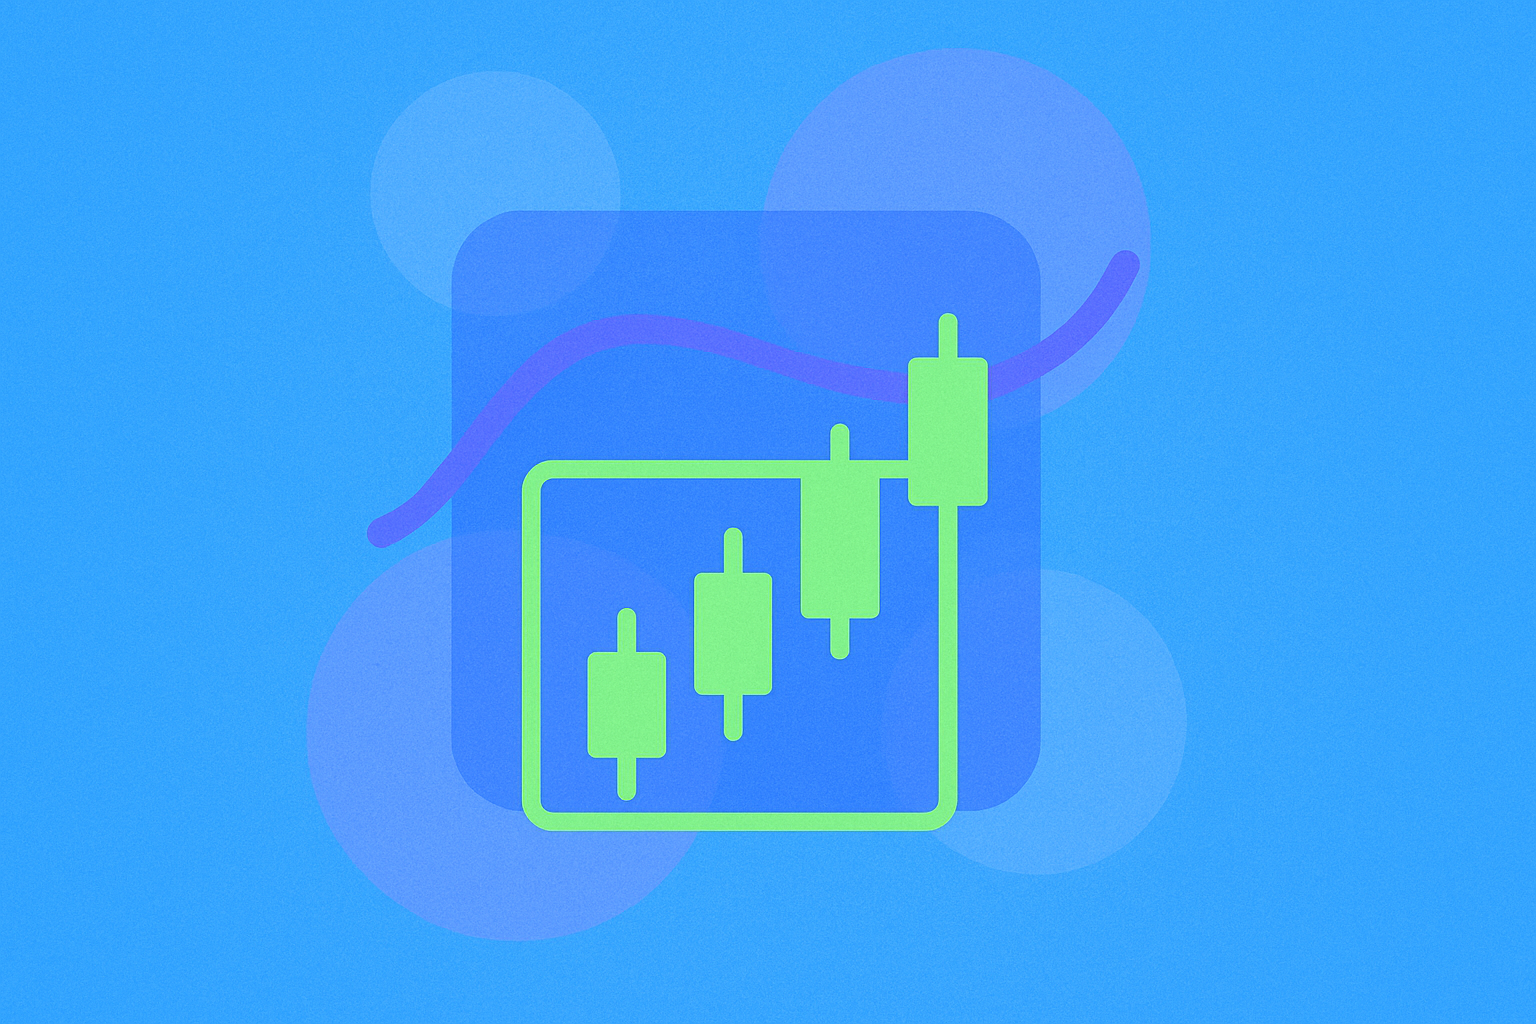
How to Use MACD, RSI, and KDJ Technical Indicators for Crypto Trading in 2026


MACD, RSI, and KDJ signals: Identifying overbought/oversold conditions and trend reversals in crypto markets
When Bitcoin and altcoins experience rapid price movements in volatile 2026 crypto markets, identifying overbought and oversold conditions becomes critical for timing entries and exits. MACD, RSI, and KDJ technical indicators each serve distinct purposes in recognizing these market extremes and potential reversals, though their effectiveness improves significantly when used together.
MACD generates trend reversal signals through line crossovers and histogram divergence patterns. When the MACD line crosses above the signal line during an uptrend, it confirms bullish momentum, while bearish crossovers below the signal line suggest weakening strength. RSI measures momentum intensity on a 0-100 scale, with readings above 70 indicating overbought conditions and below 30 signaling oversold territory. Bitcoin's RSI hitting 56.5 in November 2025 demonstrated how this indicator tracks market exhaustion cycles across different market phases.
KDJ operates similarly to RSI but adds sensitivity through its K and D lines, with the J line capturing deviation between them. This provides traders additional nuance when assessing whether crypto assets are truly extended or consolidating. The K and D lines crossing above or below the 80 or 20 thresholds respectively indicate overbought and oversold conditions with refined precision.
Crucially, these indicators work best when combined. A bearish RSI divergence paired with MACD momentum failure and KDJ reversal patterns creates higher-conviction signals for trend changes. In 2026's crypto environment, confirming signals across all three indicators significantly reduces false entries and improves trade quality, particularly during Bitcoin volatility spikes.
Moving average crossovers (golden cross and death cross): Using 20-period and 30-period MAs for entry and exit signals
When the 20-period moving average crosses above the 30-period moving average, traders recognize this as a golden cross—a bullish signal suggesting upward momentum in cryptocurrency prices. Conversely, when the 20-period MA falls below the 30-period MA, this death cross indicates potential downward pressure. These moving average crossovers have long served as popular entry and exit signals in technical analysis.
However, relying solely on golden and death crosses presents significant challenges. These crossovers frequently occur after price movements have already established themselves, meaning by the time the signal appears, much of the trend may already be priced in. This lagging characteristic can result in entering positions at unfavorable levels or exiting prematurely.
To enhance trading reliability, combining 20-period and 30-period MA crossovers with complementary indicators proves essential. This is where incorporating MACD, RSI, and KDJ indicators transforms your analysis. When a golden cross coincides with RSI below 70 (avoiding overbought conditions) and MACD showing positive histogram expansion, the entry signal carries substantially more weight. Similarly, a death cross validated by KDJ overbought readings or MACD bearish divergence provides stronger confirmation for exit points.
For crypto traders on platforms like gate, this multi-indicator confirmation approach significantly reduces false signals. The volatile nature of digital assets demands such validation layers. Rather than treating moving average crossovers as standalone trading signals, view them as one component within a comprehensive technical framework. By synthesizing these entry and exit signals with other momentum and trend indicators, you establish a more robust trading strategy capable of navigating cryptocurrency market fluctuations effectively in 2026.
Volume-price divergence analysis: Confirming trend strength and detecting potential market reversals
Volume-price divergence occurs when price and trading volume trends move in opposite directions, providing crucial insights into the sustainability of market movements. When prices reach higher highs but volume fails to increase correspondingly—or even declines—this divergence signals weakening buying pressure and potential trend exhaustion. Conversely, strong trends are confirmed when rising prices accompany increasing volume, demonstrating robust market participation and conviction.
The Volume Price Trend (VPT) indicator serves as an essential tool for identifying these divergences. A rising VPT aligned with upward price movement indicates strong accumulation, while divergence between VPT and price action often precedes significant trend reversals. For example, if a crypto asset reaches a new high but the VPT trends downward, this suggests that despite price strength, underlying buying momentum is deteriorating—a critical warning signal for traders.
Detecting potential reversals through volume-price divergence involves comparing price chart patterns against volume behavior. Higher highs with lower highs in volume particularly warrant attention, as they frequently precede downside reversals. Traders should combine these signals with other technical indicators like MACD and RSI to enhance confirmation accuracy across different timeframes. This multi-indicator approach strengthens decision-making by filtering out false signals and identifying high-probability reversal zones.
Implementing volume-price divergence analysis on trading platforms like gate provides traders with visual confirmation tools and historical data to backtest strategies. By recognizing when price and volume diverge, crypto traders can position themselves ahead of major trend changes, significantly improving their risk management and entry-exit timing throughout the trading cycle.
FAQ
What are MACD, RSI, and KDJ respectively? What are their differences and advantages and disadvantages in crypto trading?
MACD tracks trend changes via moving average crossovers; RSI identifies overbought/oversold conditions; KDJ predicts momentum shifts. MACD excels at trend confirmation, RSI at extreme levels, KDJ at quick reversals. Each suits different strategies and works best combined.
How to use RSI indicator to identify overbought and oversold signals for cryptocurrencies?
RSI above 70 indicates overbought conditions,suggesting potential price pullbacks. RSI below 20 indicates oversold conditions,suggesting potential rebounds. Combine RSI signals with other technical tools for more effective trading decisions and better market timing.
How to apply MACD golden cross and death cross signals in actual trading?
Golden cross signals uptrend potential while death cross signals downtrend. Combine these with price action and volume confirmation for reliable entries. Use alongside support/resistance levels to filter false signals and improve trade quality.
What do the K, D, and J values in the KDJ indicator represent? How to determine buy and sell timing?
K value reflects short-term trends, D value reflects medium-term trends, and J value reflects extreme fluctuations. Buy signals occur when K crosses above D (golden cross), especially in oversold zones where J is below 0. Sell signals appear when K crosses below D (death cross) in overbought zones where J exceeds 100.
How to combine MACD, RSI, and KDJ indicators to develop more reliable trading strategies?
Combine MACD for trend direction, RSI for overbought/oversold levels, and KDJ for momentum confirmation. Use MACD crossovers as entry signals, RSI (30-70) for validation, and KDJ divergence for risk management to enhance trading accuracy.
Are technical indicators still effective in the cryptocurrency market in 2026? What risks should be noted?
Yes, technical indicators remain effective in 2026's crypto market. Key risks include market volatility from regulatory changes, blockchain upgrades affecting liquidity patterns, and increased algorithmic trading creating false signals. Monitor stablecoin flows and on-chain metrics alongside traditional indicators.
How should beginners learn and practice these technical indicators? What common mistakes should be avoided?
Start with single indicators like MACD, then combine RSI and KDJ gradually. Practice on historical charts first. Avoid relying on one indicator alone, chasing false signals, or ignoring market context. Develop a systematic strategy with proper risk management before live trading.

Understanding Spot Trading in Cryptocurrency

How to Use MACD, RSI, and Moving Averages for Crypto Technical Analysis in 2025

How to Use Technical Indicators (MACD, RSI, KDJ, Bollinger Bands) for Crypto Price Prediction in 2026

Understanding Spot Trading: A Beginner's Guide

How to Use MACD, RSI, and KDJ Indicators for Crypto Technical Analysis in 2026
Understanding Digital Currency Graphs: A Beginner's Guide

Hamster Kombat Daily Cipher Code Guide: Unlock Your Bonus Rewards

How Many Pi Coins Are Mined Till Now?

Is ETH Mining Dead? Can You Still Mine Ethereum in Recent Years?

Can Avalanche Reach $10,000?

Why Is CVX Stock Down Recently: Key Factors Explained