LCP_hide_placeholder
fomox
MarketsPerpsSpotSwap
Meme
Referral
More
Smart Money Recruitment
Search Token/Wallet
/

TVL in Cryptocurrencies

2026-01-10 05:11:20
Blockchain
Crypto Ecosystem
Crypto Insights
DeFi
Layer 2
Article Rating : 4
61 ratings
Learn what TVL (Total Value Locked) means in DeFi, how to calculate it, and why it matters for investors. This complete guide covers protocols, security, and yield potential in decentralized finance on Gate.
TVL in Cryptocurrencies

Context or History

The concept of TVL (Total Value Locked) became a fundamental metric during the late 2010s with the rise of decentralized finance (DeFi). Initially, Ethereum served as the primary blockchain for DeFi applications, hosting the majority of value locked within decentralized protocols.

As the blockchain ecosystem expanded, other leading blockchains and networks—such as Polygon—began attracting substantial locked assets, further diversifying the DeFi landscape. This evolution established TVL as a widely recognized indicator for evaluating the health and growth of the DeFi ecosystem, directly reflecting the level of trust and financial commitment users are willing to make in these protocols.

Historical data shows that crypto asset TVL has undergone significant fluctuations, shaped by market trends and investor sentiment. For instance, in recent years, during periods of crypto market recovery, leading platforms like Ethereum and Solana registered notable TVL increases, signaling renewed investor confidence and engagement in DeFi activities.

Use Cases or Functionalities

TVL serves several critical functions within the blockchain and DeFi ecosystems, acting as a multifaceted indicator of protocol activity and robustness:

Security Indicator: High TVL demonstrates that significant assets are being staked or locked in a protocol, which typically enhances security defenses against attacks. When users commit large sums to a protocol, it reflects confidence in the protocol’s security mechanisms. Protocols with higher TVL generally offer stronger economic incentives to preserve system integrity, since any weakness could result in substantial losses.

Popularity Metric: TVL acts as a benchmark for assessing user trust and popularity across various DeFi platforms. Investors and analysts rely on this metric to determine which protocols are gaining market traction and which are losing relevance. Increasing TVL usually points to robust adoption and a vibrant user community.

Yield Farming Decisions: Investors use TVL to identify promising yield farming opportunities. By evaluating available liquidity in different pools, users can make informed decisions about where to allocate assets for maximum returns. High TVL in a particular pool can signal both appealing yields and improved token price stability.

Impact on the Market, Technology, or Investment Landscape

Growing TVL across platforms has made a substantial impact on the broader crypto market and investment landscape. Elevated TVL values attract greater investment flows to DeFi projects, driving technological innovation and advancement within the sector.

This influx of capital has spurred the development of increasingly sophisticated financial instruments in the blockchain ecosystem. Key advancements include automated market makers (AMMs), enabling token swaps without traditional order books; synthetic assets, which mirror the value of real-world assets on-chain; and on-chain insurance, which protects users against smart contract risks and other adverse events.

TVL has also become a crucial gauge for institutional investors evaluating the maturity and viability of the DeFi sector. A stable, increasing TVL signals a robust ecosystem capable of supporting large-scale investment, which has further established DeFi as a credible alternative to traditional finance.

Recent Trends or Innovations

Recent TVL-related innovations include the adoption of cross-chain bridges (cross-chain bridges) and Layer 2 solutions, designed to improve scalability and cut transaction costs. These technologies enable seamless asset transfers between different blockchains, increasing TVL by enhancing DeFi’s accessibility and efficiency.

Cross-chain bridges let users transfer assets across blockchains without converting to intermediary tokens, preserving value and reducing transaction friction. This breakthrough has fostered greater interoperability among previously siloed blockchains, allowing capital to flow more freely toward the best opportunities.

Layer 2 solutions—such as optimistic rollups and zk-rollups—process transactions off-chain while maintaining the security of the underlying network. This dramatically lowers gas fees and increases transaction speeds, making DeFi applications more practical for everyday users and fueling overall TVL growth.

Another emerging trend is the rise of yield aggregation protocols, which automatically optimize farming strategies to maximize user returns. These protocols move assets between pools based on market conditions, improving capital efficiency and drawing more TVL into the DeFi ecosystem.

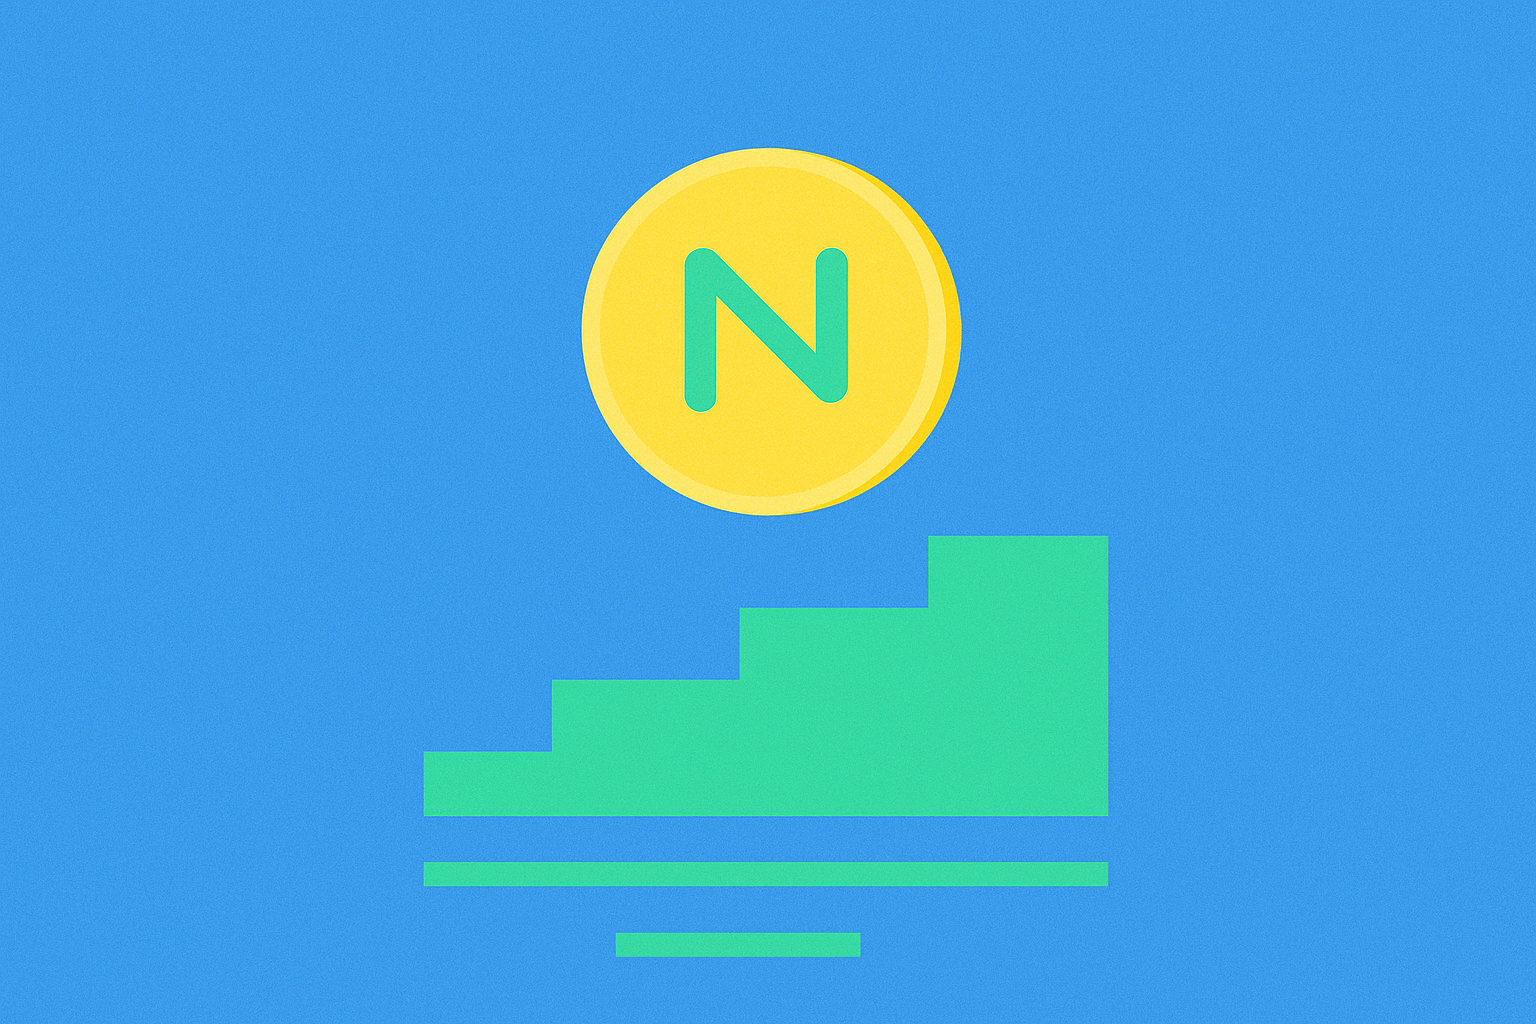
In summary, TVL stands as a vital metric in the crypto and DeFi sectors, offering actionable insights into the scale, security, and user engagement within blockchain protocols. It guides investor decision-making while powering industry innovation and growth. As blockchain technology evolves, TVL will continue to play a pivotal role in shaping the trajectory of digital finance.

FAQ

What is TVL (Total Value Locked) in cryptocurrencies and why does it matter?

TVL refers to the total capital locked in DeFi protocols. It matters because it measures the level of adoption and trust in decentralized finance. High TVL signals strong ecosystem usage and protocol resilience.

How is TVL calculated in DeFi and what related metrics exist?

TVL is calculated by summing all assets deposited in DeFi protocols (staking, lending, DEX liquidity). Key metrics include active users, fund utilization rates, trading volume, and protocol-generated fees.

Where can I track the TVL of different protocols and blockchains?

You can monitor TVL using platforms such as DefiLlama and CoinGecko, which aggregate real-time data from multiple protocols and blockchains in one dashboard.

What is the relationship between TVL and a DeFi protocol’s yield potential?

Rising TVL indicates growing confidence in a protocol and usually correlates with higher liquidity and yield opportunities. High TVL attracts more users and enhances earning prospects for liquidity providers.

What are the risks and limitations of using TVL as an investment metric?

TVL can be distorted by data manipulation and doesn’t reflect true performance. It has limitations in accuracy, fails to capture project complexities, and can obscure underlying risks. As a result, it is an incomplete metric for value analysis.

* The information is not intended to be and does not constitute financial advice or any other recommendation of any sort offered or endorsed by Gate.

Share

Content

Context or History

Use Cases or Functionalities

Impact on the Market, Technology, or Investment Landscape

Recent Trends or Innovations

FAQ

Related Articles
How Secure is Irys: A Deep Dive into Smart Contract Vulnerabilities and Network Attacks?

How Secure is Irys: A Deep Dive into Smart Contract Vulnerabilities and Network Attacks?

This article explores the security challenges Irys faces due to smart contract vulnerabilities, network attacks, and centralized exchange dependencies. It highlights specific threats such as reentrancy and flash loan attacks, as well as custodial risks inherent to centralized platforms like Gate. Irys's mitigation strategies, including security audits and self-custody solutions, are examined to safeguard user assets and privacy. The text is structured to offer insights into increasing attack vectors, emphasizing the importance of decentralized solutions and strategic portfolio management for risk reduction.
2025-11-26 01:13:59
How Did Sui Network Lose $223 Million in a Single Hack?

How Did Sui Network Lose $223 Million in a Single Hack?

The article delves into the $223 million security breach on Sui Network's Cetus Protocol, dissecting how a smart contract flaw allowed the exploit. It emphasizes Sui's responsive actions, freezing $162 million to mitigate damages, which sparked a debate about decentralization's core principles. The coverage extends to rebuilding trust in the Sui ecosystem post-breach, highlighting the network's ongoing challenges in cybersecurity and investor confidence. Readers gain insights on complex blockchain governance issues, strategies for enhancing security, and understanding the balance between safety and decentralization.
2025-12-02 01:32:14
How Does Regulatory Compliance Impact Cryptocurrency Adoption and Risk?

How Does Regulatory Compliance Impact Cryptocurrency Adoption and Risk?

The article delves into the impact of regulatory compliance on cryptocurrency adoption and risk management, focusing on how SEC's evolving regulations influence projects like Arbitrum. It highlights the significance of transparency in audit reports and stricter KYC/AML policies in enhancing investor confidence and reshaping exchange operations. Readers will gain insight into the correlation between high-profile regulatory actions and market volatility, and how these factors affect institutional participation and token valuations. Ideal for industry participants seeking to understand compliance dynamics, the content is structured for quick scanning with optimized keyword placement.
2025-11-21 03:08:26
How Can On-Chain Data Analysis Reveal Crypto Market Trends in 2025?

How Can On-Chain Data Analysis Reveal Crypto Market Trends in 2025?

The article explores how on-chain data analysis reveals crypto market trends in 2025, focusing on active address surges, transaction volumes, whale movements, and network congestion. It highlights Onyx Protocol's widespread adoption and blockchain maturity as transaction volumes hit $10 trillion, reflecting institutional engagement and robust Web3 infrastructure. Additionally, it analyzes XCN token concentration and whale impacts, offering insights for traders and developers. The content targets blockchain users, analysts, and investors, structuring sections on adoption indicators, market maturity, and network challenges to aid strategic decisions, enhancing readability and keyword density for effortless scanning.
2025-11-23 01:18:45
What are the key on-chain metrics for analyzing blockchain activity: active addresses, transaction volume, whale distribution, and gas fees

What are the key on-chain metrics for analyzing blockchain activity: active addresses, transaction volume, whale distribution, and gas fees

This article provides a comprehensive framework for analyzing blockchain activity through key on-chain metrics, using Internet Computer (ICP) as a case study. It examines daily transaction volume reaching $425,658 as an indicator of genuine network utility and adoption. The content explores how governance rewards and staking mechanisms create measurable activity patterns, while ICP's Chain Fusion technology revolutionizes cross-chain interoperability with Bitcoin, Ethereum, and Solana through Gate integration. The guide analyzes ecosystem growth indicators, including active addresses, whale distribution patterns, and gas fee dynamics, demonstrating how these metrics collectively reveal authentic blockchain health beyond price speculation. Comprehensive FAQs address practical applications for assessing project value and interpreting market signals, making this essential reading for analysts, investors, and developers seeking data-driven blockchain evaluation strategies.
2026-01-15 01:15:35
What Is Sui Network's Core Value Proposition in the 2025 Blockchain Landscape?

What Is Sui Network's Core Value Proposition in the 2025 Blockchain Landscape?

The article explores Sui Network's core value proposition, emphasizing its innovative parallel transaction processing technology and scalability. It addresses Sui's growth with over 500 projects and $1 billion+ in TVL, highlighting its suitability for high-demand applications like DeFi, gaming, and NFTs. The article covers Sui's strong institutional support, with $336 million funding from key investors, positioning it among top Layer-1 blockchains. Analysts anticipate significant price potential for SUI tokens by 2025. Keywords include: Sui Network, parallel processing, scalability, DeFi, institutional backing, price prediction.
2025-11-05 01:32:36
Recommended for You
What is BOT project fundamentals: whitepaper logic, use cases, technology innovation and team background explained

What is BOT project fundamentals: whitepaper logic, use cases, technology innovation and team background explained

This comprehensive guide explores BOT project fundamentals, detailing the Build-Operate-Transfer model as an innovative government-private partnership framework for large-scale infrastructure development. The article examines core architecture principles, multi-stage implementation spanning 10-30 years, and sophisticated risk management strategies addressing construction complexity. It highlights how BOT projects leverage private sector expertise while ensuring eventual public asset transfer, with proven effectiveness across global infrastructure initiatives. The guide covers team execution frameworks, government guarantee mechanisms, and stakeholder coordination protocols essential for project success. Additionally, it addresses tokenomics, acquisition methods, and practical applications, providing investors and stakeholders with complete insights into BOT ecosystem technology innovation, operational excellence, and long-term value creation on Gate platform.
2026-01-15 04:18:05
Why Do All Cryptocurrencies Fall Together?

Why Do All Cryptocurrencies Fall Together?

This comprehensive guide explores why cryptocurrencies experience synchronized downturns, stemming from market interconnection, macroeconomic pressures, and institutional trading patterns. Bitcoin and Ethereum serve as market bellwethers, triggering cascading effects across altcoins through algorithmic trading and portfolio rebalancing. Understanding these dynamics enables investors to implement effective risk management strategies, identify buying opportunities during panic-driven corrections, and optimize portfolio diversification across the cryptocurrency ecosystem. High correlation coefficients exceeding 0.75 among top cryptocurrencies demonstrate the limited protection offered by diversification within the asset class alone. Real-world examples showcase how central bank policy decisions, regulatory announcements, and technological developments create market-wide reactions affecting all digital assets. By recognizing these patterns and maintaining disciplined investment approaches, stakeholders can naviga
2026-01-15 04:15:25
What is NPC price volatility: historical trends, support resistance levels, and 2026 price prediction

What is NPC price volatility: historical trends, support resistance levels, and 2026 price prediction

This comprehensive guide analyzes NPC price volatility, tracing its remarkable journey from $0.00002595 to current $0.012673 levels, with an all-time high of $0.07226 in September 2024. Understand critical support and resistance levels at $0.010251 and $0.032024 that define current trading ranges, essential for technical traders using Gate and other platforms. The article explores recent 24-hour declines alongside 2026 upside potential of 57.46%, revealing how supply-demand dynamics and macroeconomic factors drive NPC price fluctuations. Discover support levels at $0.0124 and $0.0101, with resistance targets at $0.0165, $0.0211, and $0.0239. Perfect for investors seeking data-driven insights into memecoin volatility patterns and informed price prediction strategies.
2026-01-15 04:14:07
What is SEI crypto market cap and 24-hour trading volume in 2026

What is SEI crypto market cap and 24-hour trading volume in 2026

This article provides a comprehensive analysis of SEI cryptocurrency's market performance in 2026. SEI has achieved a market cap of $817.41 million with a fully diluted valuation of $1.215 billion, establishing itself as a dominant trading-focused Layer 1 blockchain. The token maintains a 24-hour trading volume of $57.53 million, supported by listings across 50 exchanges including Gate, demonstrating robust market liquidity and institutional adoption. With 6.49 billion tokens in circulation against a 10 billion total supply cap, SEI exhibits moderate inflation pressure and controlled token economics. The article examines how this supply structure, combined with strong exchange coverage, enables efficient price discovery and minimal trading slippage. For investors and traders, the combination of substantial daily volume, extensive exchange accessibility, and strategic token distribution reflects sustained market confidence in SEI's trading infrastructure utility and long-term viability within the competitive L
2026-01-15 04:11:06
A Strong Stock Market Depends On Key Economic Drivers

A Strong Stock Market Depends On Key Economic Drivers

This comprehensive guide explores the multifaceted factors that drive stock market strength. The article examines how technological innovation and sector leadership propel market growth, the critical role of export performance and economic fundamentals, and the rising influence of retail investor participation. It analyzes how government policies and regulatory frameworks create supportive investment environments, while addressing inherent market risks and volatility concerns. The piece also highlights institutional adoption of new asset classes and their role in market evolution. Practical strategies include monitoring sector trends, tracking policy changes, diversifying across geographies and asset classes, maintaining long-term perspectives, and continuous financial education. Understanding these interconnected drivers enables investors to make informed decisions and navigate market cycles effectively on platforms like Gate.
2026-01-15 04:09:14
How does on-chain data analysis reveal INJ token market trends with 13.2M active addresses in 2025?

How does on-chain data analysis reveal INJ token market trends with 13.2M active addresses in 2025?

This article reveals INJ token market dynamics through comprehensive on-chain data analysis, featuring 13.2 million active addresses across the Injective ecosystem in 2025. The analysis covers three critical dimensions: ecosystem adoption metrics demonstrating sustained user engagement with 1.2 million daily active addresses, whale movements and DeFi trading volume patterns that drive short-term price volatility on Gate and other platforms, and token economics featuring weekly burn auctions that have removed over 5.8 million INJ tokens from circulation. By examining these on-chain indicators—from transaction volumes to institutional accumulation patterns—the article provides investors with actionable insights into INJ's market trends and fundamental value drivers, offering a roadmap for interpreting blockchain data to identify emerging opportunities within Injective's rapidly expanding DeFi ecosystem.
2026-01-15 04:09:02