What is cryptocurrency holdings and capital flows: How to analyze exchange inflows, staking rates, and institutional positions?

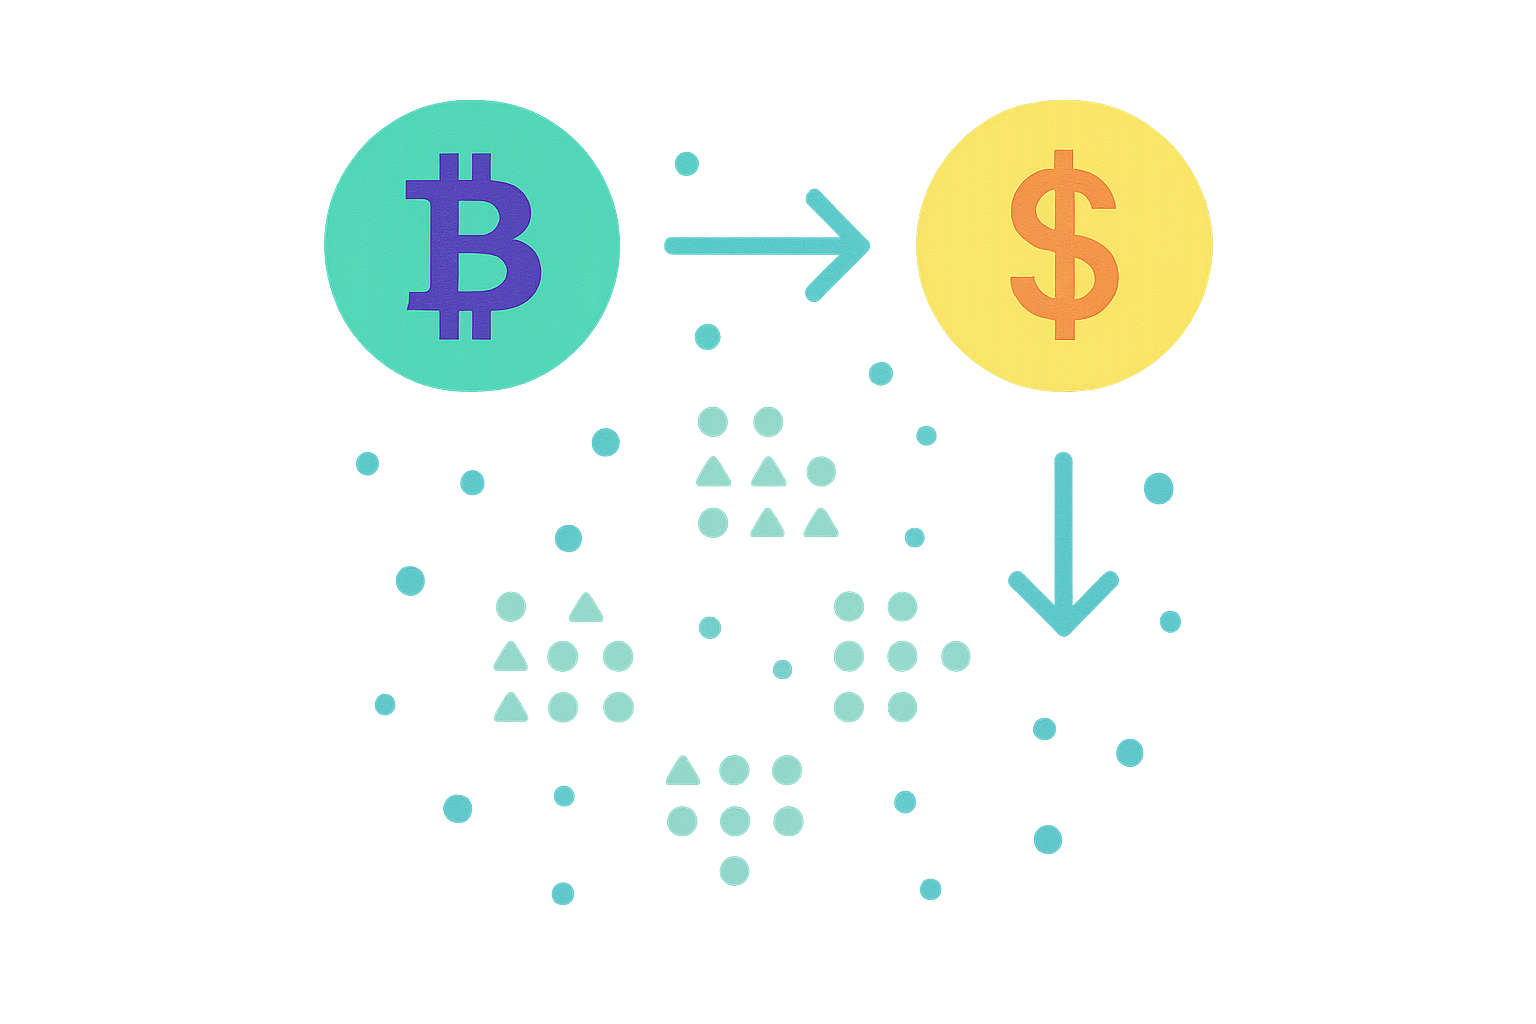
Exchange Net Inflows and Outflows: Understanding Capital Movement Across Major Platforms
Tracking the movement of capital across cryptocurrency platforms provides crucial insights into market dynamics and investor behavior. Exchange net inflows and outflows represent the quantity of digital assets entering or leaving major trading venues, serving as a barometer for market sentiment and liquidity distribution. When significant capital concentrates on exchanges, it often signals preparation for large trades or potential selling pressure, whereas outflows typically indicate investors moving assets to personal wallets for long-term holding or staking purposes.
The analysis of these capital flows requires understanding multiple platforms simultaneously, as institutional investors and retail participants strategically allocate holdings across different exchanges based on trading pairs, fee structures, and regulatory environments. Major exchanges like gate function as central hubs where supply and demand interact, making their inflow patterns particularly instructive for predicting price movements. By monitoring net inflows against trading volumes and price action, analysts can distinguish between genuine market interest and artificial activity.
Institutional positions amplify the significance of exchange capital movement data. When institutions reduce exchange holdings substantially, it suggests confidence in long-term valuations, whereas rapid institutional deposits may precede large execution orders. Understanding these nuanced patterns within the broader cryptocurrency ecosystem helps stakeholders make informed decisions about timing, position sizing, and risk management across platforms.
Holding Concentration and Staking Rates: How Institutional Positions Drive Market Volatility
Institutional positions represent a critical driver of cryptocurrency market dynamics, with holding concentration directly influencing price volatility and trading patterns. When institutional investors accumulate assets, their large-scale purchases typically trigger increased trading volume and price appreciation, reflecting their confidence in market direction. Conversely, distribution phases often result in pronounced price drops coupled with declining volume, as these significant market participants unwind their positions.
The concentration of holdings among top addresses creates inherent market fragility. Recent market analysis reveals that nearly 79% of institutional investors anticipate market corrections, prompting them to reassess portfolio positioning. This institutional sentiment translates into measurable on-chain behavior, where staking rates serve as indicators of long-term commitment versus short-term positioning. Higher staking rates suggest institutional confidence and reduced selling pressure, while declining rates signal potential distribution cycles ahead.
Active management strategies have become paramount for institutional players navigating these dynamics. With 63% of institutional investors prioritizing active management in their portfolios, tactical positioning and timing of accumulation and distribution events carry substantial weight. Geopolitical risks compound these volatility patterns, as institutional capital flows rapidly respond to macro events, amplifying concentration swings.
Understanding these institutional position cycles proves essential for analyzing market volatility. The relationship between holding concentration, staking behavior, and institutional activity creates predictable patterns: accumulation periods typically precede bullish phases with expanding volume, while preparation for distribution manifests through declining staking participation and weakening support levels. By monitoring these institutional position indicators alongside exchange inflow data, traders can better anticipate volatility regime shifts and market structure changes.
On-Chain Lock-up Volume and Liquidity Dynamics: Analyzing Real Capital Backing and Price Stability
On-chain lock-up volume serves as a critical indicator of genuine capital backing within cryptocurrency projects. When substantial portions of tokens remain locked through vesting schedules or treasury reserves, they reduce immediate selling pressure and signal long-term project commitment. For instance, projects maintaining significant circulating supply constraints—such as those with only 4-5% of total tokens in circulation—demonstrate controlled token economics designed to stabilize valuations. These lock-up mechanisms, whether through smart contract vesting or cold storage reserves, create predictable supply schedules that allow market participants to anticipate future liquidity shifts.
Liquidity dynamics directly correlate with the availability of unlocked capital. Real capital backing becomes verifiable when examining both centralized exchange order books and decentralized liquidity pools. Higher lock-up volumes typically translate to tighter spreads and more stable pricing mechanisms across trading venues. As vesting schedules release tokens incrementally, the market absorbs new supply gradually rather than experiencing sudden price shocks. This structured approach to capital release maintains price stability by aligning token unlocking with organic demand growth. Analyzing historical lock-up release dates alongside price movements reveals how disciplined supply management prevents catastrophic volatility spikes. Projects with transparent treasury reserves and documented vesting schedules attract institutional participants who value predictable market conditions. Therefore, understanding on-chain lock-up volume and associated liquidity patterns provides essential insights into whether cryptocurrency holdings represent genuine value foundations or speculative assets lacking fundamental backing.
FAQ
What are exchange inflows and how do they reflect market sentiment?
Exchange inflows represent cryptocurrency deposits into trading platforms. Large inflows typically indicate increased selling pressure or profit-taking, suggesting bearish sentiment, while inflows of stablecoins may signal buying opportunities ahead. Monitoring these flows reveals investor behavior and market trends.
How to analyze Bitcoin/Ethereum net inflows on exchanges to determine market bottoms or tops?
Monitor long-term holder sentiment using LTH-NUPL indicator; when below zero, holders are in losses, signaling bottoms. Track profit supply ratio; when below 50%, majority holdings are underwater, indicating buying opportunities. High stablecoin supply ratio signals market overheating and potential tops.
What is cryptocurrency staking rate (Staking Rate) and what is its relationship with market cycles?
Staking rate measures the proportion of crypto assets locked in blockchain networks for yield generation. Higher staking rates typically indicate increased investor confidence and can signal bull or bear market trends. Staking rate changes directly impact capital flows and market sentiment, serving as a leading indicator of fund allocation cycles.
Where to view institutional investor holdings data and how to interpret its significance?
Institutional holdings data can be accessed through blockchain analytics platforms and on-chain monitoring tools. High institutional concentration indicates strong market confidence and potential stability, while increasing positions suggest bullish sentiment. Analyzing flow patterns helps predict market trends and identify key support levels for cryptocurrencies.
How to assess whale trading behavior through on-chain analytics?
Track large transactions and asset transfers on-chain to identify whale activity. Monitor exchange inflows and outflows, analyze transaction patterns, and use on-chain tools to detect significant position changes. Cross-reference data to assess buying and selling intentions.
What is the difference in capital flows between exchange cold wallets and hot wallets, and how does it help with price prediction?
Hot wallets enable frequent trading but carry security risks; cold wallets store assets offline with superior security. Hot wallet inflows indicate selling pressure while outflows suggest accumulation, directly impacting price movements and market sentiment analysis.
What is crypto holding and fund flow: Exchange inflows, staking rates, and institutional positions explained

What Is Crypto Exchange Net Inflows and How Do They Affect Token Price and Market Cap?

What is the impact of exchange net flows and staking rates on crypto market movements?

What is crypto holdings and capital flow: how exchange inflows, staking rates, and institutional positions impact market movement?

What is crypto exchange net flow and how does it affect coin price movements?

How Does the Crypto Market's Price Volatility Compare to Traditional Assets in 2025?

What is WFI fundamental analysis: how do whitepaper logic, use cases, and team roadmap impact token value in 2026

What is a token economic model and how do allocation mechanisms, inflation design, and governance rights affect crypto value

What is BabyDoge coin and how does its deflationary mechanism work in 2026?

What are the key derivatives market signals to watch in crypto trading: futures open interest, funding rates, and liquidation data explained

What is Dash (DASH) market overview: price, market cap, and 24-hour trading volume in 2026