最新市场矛盾:价格上行,但合约情绪偏空
最近几天,市场给出一个看似矛盾的画面:
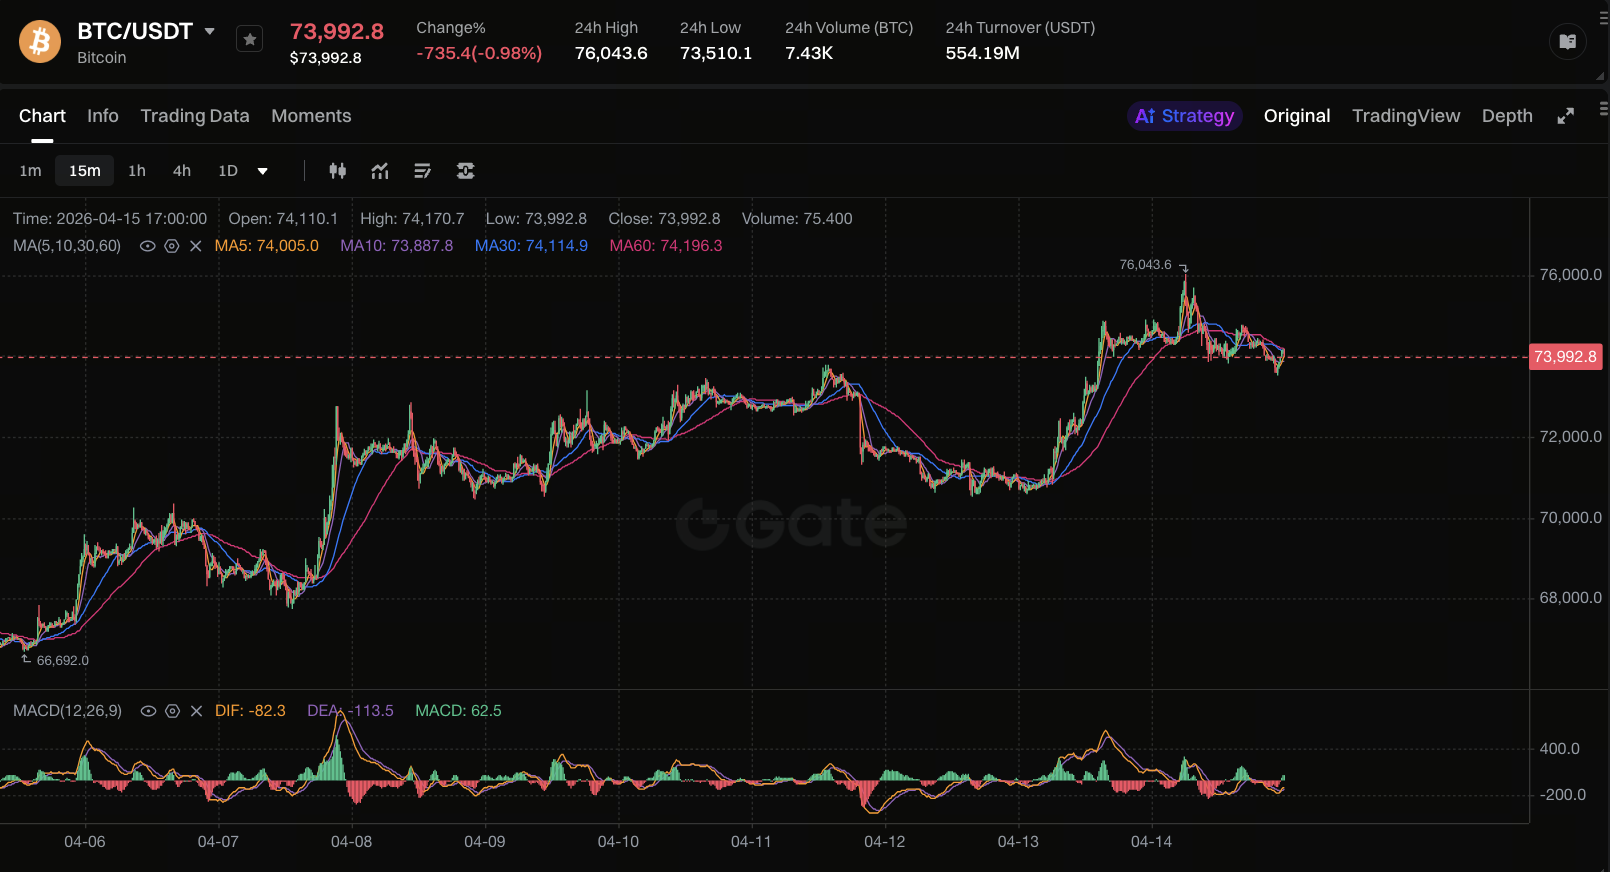
图源:Gate 行情页面
一方面,比特币冲高至 7.6 万美元附近后回落,整体价格中枢较前期抬升;另一方面,主流 CEX、DEX 的资金费率并未同步转强,反而维持偏空区间,且部分时段空头情绪较前一日更重。
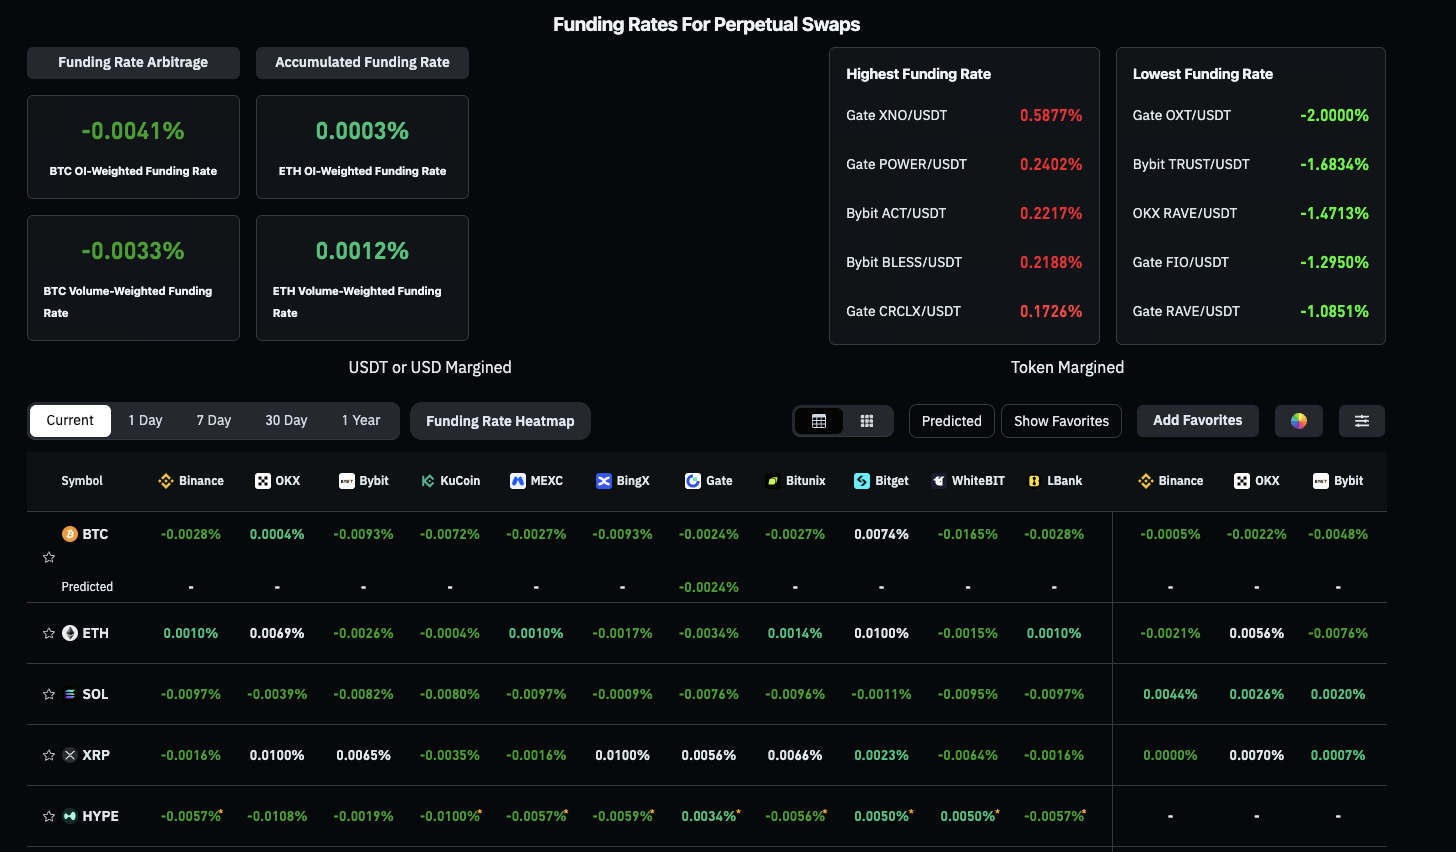
这是市场结构变化后的常态。过去散户主导周期里,价格上涨往往伴随费率迅速转正并拥挤做多;现在机构化程度提高后,价格驱动力和合约情绪来源开始分离,出现“现货偏强、合约偏空”的并存状态。
为什么会出现“涨价 + 负费率”并存
现货买盘与合约仓位来自不同人群
现货端增量越来越多来自 ETF、资管账户、配置型资金;合约端仍以高频与短线交易为主。
前者关注季度配置与风险预算,后者关注日内波动与短期回撤。两者时间框架不同,信号自然经常背离。
机构对冲行为会系统性压低费率
在机构参与加深后,常见策略是“现货多头 + 永续空头”或“ETF 持仓 + 衍生品对冲”。
这类策略不是方向性看空,而是风险管理需求,却会在盘口上体现为空单供给增加,从而压低资金费率。
冲高回落会强化短线空头叙事
当价格突破关键位后回落,短线交易者容易把它解读为“假突破”。
如果这个阶段费率本就偏低,新增空单会进一步加深偏空读数,形成“价格未转弱但情绪先转空”的现象。
费率是拥挤度指标,不是趋势预言器
资金费率本质是永续合约多空成本调节机制。
它能回答“谁更拥挤”,但不能单独回答“趋势是否结束”。在机构化周期里,单看费率下结论,误判概率会明显上升。
华尔街入场改变了什么:从交易市场到产品市场
如果说 2024 年是“现货 ETF 合法化”的起点,那么 2026 年正在进入“产品化竞争”阶段。
高盛提交 Bitcoin Premium Income ETF 申请,就是一个标志性事件:华尔街不再只卖比特币方向,而是卖比特币波动率与收益结构。
这会带来三层变化:
-
资金入口变化:加密资金不再只靠交易所与链上桥接,传统财富管理渠道开始成为增量入口。
-
资金属性变化:短线追涨资金占比下降,中低换手、风险预算驱动资金占比上升。
-
定价方式变化:市场从“只看现货涨跌”转向“现货 + 波动率 + 产品需求”的综合定价。
因此,今天的加密市场更像一个分层金融市场,而不是单一情绪市场。
新资金结构下的轮动逻辑:BTC、ETH 与高 Beta 资产
在资金分层背景下,轮动节奏也在重排:
-
第一层:BTC 核心化,机构资金优先配置流动性最强、合规路径最清晰的 BTC。
-
第二层:ETH 枢纽化,当 BTC 稳住后,部分风险预算向 ETH 扩散,体现为 ETH 相对强弱改善与活跃度回升。
-
第三层:高 Beta 主题化,山寨币仍有机会,但更依赖明确催化与流动性承接,不再是“普涨型贝塔”。
即便费率偏空,价格仍可能维持韧性的原因是支撑价格的资金,并不一定在永续合约里。
这轮行情的核心风险:不是没钱,而是错配
当前最大风险不是“市场完全没有增量”,而是“增量资金与交易结构错配”。主要体现在:
-
现货慢变量资金在进场,但合约端杠杆博弈过度。
-
机构资金偏好核心资产,市场把它误读成全市场牛市。
-
风险资产轮动速度快,追涨资金在错误阶段放大仓位。
这会导致一种典型后果:指数看起来不弱,但个体资产体验分化极大。投资者若仍按旧周期“全面扩散”逻辑交易,容易在结构性行情里反复回撤。
实战框架:用 3 个指标判断行情延续性
在“价格与费率背离”的阶段,建议至少同时看 3 组数据,而不是盯一个信号。
-
资金费率(情绪层) 看多空拥挤度是否极端。偏空不必然看跌,但可提示潜在挤空或反身性风险。
-
未平仓量 OI(杠杆层) 价格上涨时,若 OI 同步上升,说明有新增杠杆参与;若 OI 下降,更多是空头回补。两者可持续性不同。
-
现货净流与 ETF 资金(现金层) 这是判断趋势“有没有真实买盘托底”的核心。没有现金流承接,任何技术性反弹都更脆弱。
一个简化判读法:
-
费率偏空 + OI 上升 + 现货净流入:上涨延续概率提升,警惕被动挤空。
-
费率偏空 + OI 上升 + 现货转弱:更像高位博弈,冲高回落风险上升。
-
费率中性 + OI 温和 + 现货持续流入:结构最健康,适合趋势持有。
结论:市场不是单边牛熊,而是结构再定价
当前在价格反弹阶段,资金费率依然偏空。这恰恰说明当下市场进入了新阶段——不是简单牛熊切换,而是资金来源、产品结构、风险表达方式的再定价。
未来一段时间,判断行情不应再用单线思维。更有效的方式是:把价格放在结果层,把费率放在拥挤度层,把 ETF 与现货流放在驱动力层。三者同向,趋势才稳;三者背离,交易就该降速。
在机构化时代,最危险的不是看空或看多,而是用旧市场的经验,解释新结构的价格。
相关文章
除了 ETF,谁在重新塑造 2026 年加密市场的机构买盘结构

什么是 USDD?去中心化稳定币完整指南
Polygon 主网:以太坊 Layer 2 扩容与治理新格局

冷钱包是什么?全面解析加密资产安全储存与自我托管的重要性