How does crypto price volatility impact your trading decisions and investment returns?
Understanding Price Volatility: Measurement Methods and Market Impact on Trading Decisions
Measuring price volatility requires understanding multiple methodologies that reveal different aspects of market risk. Historical volatility captures past price fluctuations over specific periods, serving as a baseline for evaluating current market conditions. In contrast, implied volatility reflects market expectations of future price swings derived from options pricing, offering forward-looking insights. These two measures often diverge significantly, creating crucial signals for traders making strategic decisions.
Traditional measurement methods extend beyond these fundamental approaches. Range-based estimators like Parkinson and Garman-Klass models analyze high-low price movements within trading periods, while GARCH and EGARCH frameworks predict volatility clustering—the tendency for high volatility periods to follow one another. The HAR (Heterogeneous Autoregression) model often demonstrates superior forecasting performance by incorporating multiple time horizons.
Market impact of volatility directly shapes how traders adjust their positions and risk management tactics. When volatility spikes, bid-ask spreads widen significantly, increasing transaction costs and reducing liquidity. Traders respond by tightening stop-loss orders, reducing position sizes, and carefully managing leverage to protect portfolios during turbulent periods. Expected Shortfall measures provide more comprehensive risk assessment than traditional Value-at-Risk calculations, particularly during high-volatility environments. Understanding these measurement methods and their implications transforms raw price data into actionable intelligence that fundamentally influences trading decisions and portfolio positioning strategies.
Historical Price Trends and Support-Resistance Levels: Identifying Key Trading Opportunities
Understanding historical price trends provides traders with a strategic framework for navigating crypto volatility. Chart patterns like breakouts and reversals emerge from years of market data, revealing where prices tend to encounter barriers. These patterns become invaluable when identifying support and resistance levels, which act as psychological thresholds where buying and selling pressure converge.
Traders identify these key price levels using multiple technical tools: trendlines drawn across price highs and lows, moving averages that smooth price action, and Fibonacci ratios that often align with natural support zones. Once established, these levels become decision points. When price approaches resistance, traders anticipate potential reversals or breakouts. A break above resistance with increased volume signals that demand has overwhelmed supply, suggesting a potential continuation of the uptrend.
The real power emerges when prices retest these levels after breaking through them. A successful retest of broken resistance—now acting as support—confirms the strength of the breakout and provides a lower-risk entry point. Conversely, breakdowns below support indicate bears have gained control, often prompting trend reversals.
Consolidation zones, where prices bounce between clear support and resistance bands, present traders with defined risk parameters. Understanding these technical patterns allows investors to make informed decisions during volatile periods, setting precise stop-losses and profit targets based on objective price action rather than emotion.
Recent Price Movements and Volatility Clustering: How GARCH Models Predict Market Swings
Financial markets exhibit a well-documented phenomenon known as volatility clustering, where periods of intense price movement tend to group together temporally rather than distribute randomly. Empirical research confirms that traders themselves use recent volatility patterns as signals when executing orders, amplifying this clustering effect through behavioral responses. This observation is fundamental to understanding why traditional constant-volatility models fail to capture real-world market dynamics. GARCH (Generalized Autoregressive Conditional Heteroskedasticity) models provide a sophisticated solution by adapting to these changing market conditions rather than relying on static historical averages. Unlike conventional approaches that assume uniform volatility, GARCH family models estimate volatility dynamically by incorporating past market behavior and recent price shocks. This adaptive capability makes GARCH particularly valuable for asset pricing, investment return forecasting, and risk management strategies. During periods of market stress or heightened uncertainty, GARCH models excel at detecting volatility patterns that directly influence both pricing accuracy and portfolio optimization decisions. Empirical evaluations consistently demonstrate that GARCH-based volatility forecasts outperform alternative models in terms of mean squared error and prediction accuracy across multiple financial datasets. For traders seeking to understand how recent price movements might signal future market swings, GARCH models provide a quantitative framework connecting observed volatility clustering to actionable insights for refining trading decisions and managing investment returns.
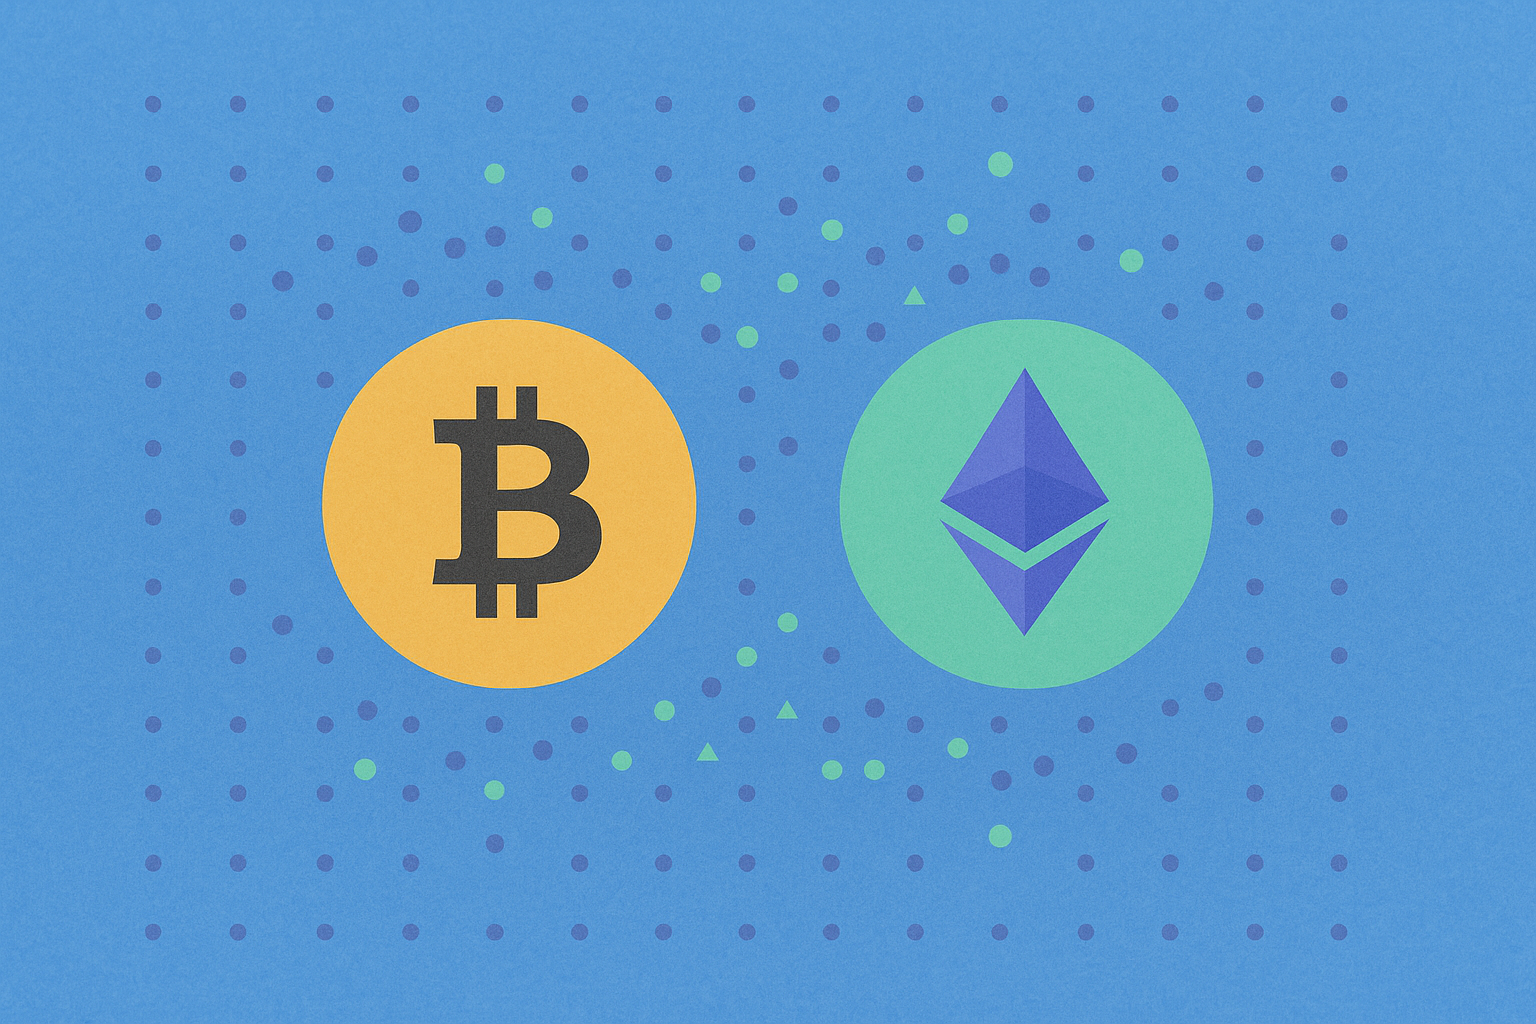
Cryptocurrency Correlation Analysis: BTC and ETH Linkages Shaping Investment Returns
The relationship between Bitcoin and Ethereum has become central to understanding crypto portfolio behavior over the past decade. Historical data from 2016 to 2026 reveals a persistently strong correlation between these two digital assets, yet their performance divergence in specific periods offers valuable insights for investors managing cryptocurrency exposure.
The drivers of BTC-ETH linkages are multifaceted. Market microstructure factors, trade volume dynamics, and macroeconomic policy shifts collectively influence their price co-movements. Institutional capital flows occasionally create temporary decoupling, though the overall trend maintains substantial synchronicity. This interconnection reflects how both assets respond to similar market conditions and regulatory developments.
| Metric | Bitcoin | Ethereum |
|---|---|---|
| Avg Return (Full Period) | 43.88% | 28.83% |
| Max Return | 74.55% | 97.04% |
| January Outperformance | Lower | Higher |
For portfolio construction, strong correlation presents a critical challenge. When Bitcoin and Ethereum move in lockstep, their combined effect amplifies risk exposure rather than providing diversification benefits. This relationship complicates effective drawdown management during market stress, as both positions often decline simultaneously. However, Bitcoin's comparatively lower correlation with traditional asset classes—equities, bonds, and commodities—preserves its value within diversified portfolios.
The performance data underscores nuanced opportunities: Ethereum's superior January returns and higher average November gains suggest seasonal patterns that sophisticated traders can exploit. Meanwhile, Bitcoin's more stable risk-adjusted metrics make it attractive for long-term strategic allocation, even as short-term correlation dynamics fluctuate based on market regime changes.
FAQ
How does crypto price volatility directly impact the profitability of short-term trading?
Price volatility creates frequent profit and loss opportunities for short-term traders. High volatility increases both risk and potential gains, as rapid price swings enable traders to capitalize on price movements. Short-term holders experience alternating realized gains and losses based on market fluctuations and entry/exit timing.
What risk management strategies should investors adopt in highly volatile markets to protect investment returns?
In volatile crypto markets, employ portfolio diversification, set stop-loss orders, and use position sizing. Dollar-cost averaging reduces timing risk. Maintain adequate reserves and rebalance regularly to protect returns while managing downside exposure.
How does price volatility impact investment returns differently for long-term holders and short-term traders?
Price volatility significantly affects short-term traders who profit from small price movements through frequent transactions, requiring active market monitoring. Long-term holders are less impacted as they focus on overall value appreciation over extended periods, weathering short-term fluctuations without concern.
How to identify and predict cryptocurrency price volatility cycles to optimize trading timing?
Identify volatility cycles through technical analysis, historical price data, and trading volume patterns. Use moving averages, RSI, and MACD indicators. Monitor market sentiment and on-chain metrics. Machine learning models can forecast short-term price movements to enhance timing accuracy.
Which type is more suitable for investors with different risk tolerances, between high-volatility cryptocurrencies and stablecoins?
Low-risk investors should choose stablecoins for price stability and capital preservation. High-risk investors can opt for volatile cryptocurrencies like Bitcoin for greater growth potential despite higher volatility. Both can be combined based on individual risk tolerance and investment objectives.
How do emotional fluctuations and market volatility jointly impact trading decision quality and final investment returns?
Emotional fluctuations and market volatility together distort trading decisions, causing irrational choices and reduced returns. Emotional biases amplify volatility impact, leading to poor timing and excessive trading volumes that erode profitability significantly.

What Are the Latest Derivative Market Signals for Crypto in 2025?

The Essential Guide to Shorting Bitcoin and Other Cryptocurrencies

Volatility

The Impact of Cryptocurrency Volatility on Trading: Essential Information for Traders

How can derivatives market signals predict crypto price movements: futures open interest, funding rates, and liquidation data explained

How Do Derivatives Market Signals Predict Crypto Price Movements?

Roam Listing Details: Launch Date, Price Predictions, and How to Buy $ROAM

DePIN: Hardware Set to Transform Web3

MACD指標是什麼?

Bitget Wallet Valued at $300 Million After Investment from Mainstream Exchange, Boasts 10 Million Users

How to Buy $LUNA Coin and What is the Lynk's Cat Token?